
Maple
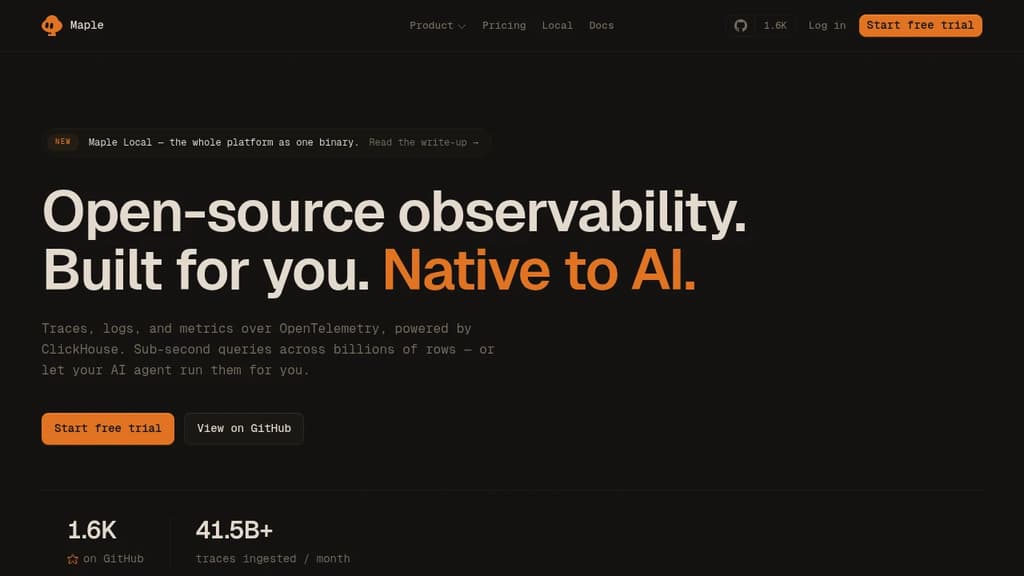
Observability platform built on OpenTelemetry and ClickHouse. Collect, visualize, and query distributed traces, logs, and metrics, with an MCP server for AI agent diagnostics.
Open Source Alternative to:





Last 30 days
Last commit
7 hours agoRepository age
8 monthsVersion
v0.0.29Self-hosted
YesRepository
mapletechlabs/maple
Maple is an observability platform for distributed systems, built on OpenTelemetry and backed by ClickHouse for sub-second queries across billions of rows. It handles traces, logs, and metrics in one place, with correlated data across all three signals tied to a single trace ID. No stitching between tools, no second search in a second product.
The incident workflow is its sharpest edge. An alert arrives carrying the service, the broken threshold, and sample traces. From there you open the failing span tree, jump to correlated logs on the same trace ID, and see exactly what happened. Retry exhaustion, a full connection pool, three Stripe timeouts at 1.75 seconds each – all visible without switching tabs.
Key capabilities:
- Distributed tracing – full span trees with every attribute intact, no sampling gap hiding the outlier
- Structured logs – OTLP logs searchable by severity, service, message, and duration in seconds
- Session replay – browser clicks, routes, console lines, and failed requests, joined to spans by session ID
- Metrics and dashboards – request rate, error rate, latency percentiles, drag-to-build or agent-suggested
- Service maps – live request flow across services, the dependency cascade you'd otherwise reconstruct after the fact
- Error tracking – errors grouped by type, with trends, affected services, and sample traces attached
- Alerting – seven signal types with severity, incident tracking, and auto-resolution; routes to Slack, Discord, PagerDuty, or any webhook
- MCP server – any compatible AI agent (Claude, Cursor, others) can list services, search traces, read source files, and open a PR with a proposed fix
- Kubernetes integration – Helm chart that joins spans to pod, node, and namespace; kube-state metrics included
Compared to tools like HyperDX or Uptrace, Maple's first-class MCP surface is a genuine differentiator. The agent doesn't just read dashboards – it pulls the source file behind a failing span, so the fix it proposes cites your actual code. It can also write back: claim an issue, set severity, attach a fix.
The local mode runs as a single compiled binary with an embedded ClickHouse, OTLP ingest, query API, and dashboard – all on localhost, no account required. For production, you can self-host against your own ClickHouse or use the hosted plan at $39/month for 100 GB per signal, then $0.30/GB flat. No per-host fees. No per-seat fees.
The source is on GitHub under FSL-1.1, which converts to Apache 2.0 two years after each release. OpenTelemetry in means no proprietary agent and no re-instrumentation if you switch.











Last 30 days
Last commit
7 hours agoRepository age
8 monthsVersion
v0.0.29Self-hosted
YesRepository
mapletechlabs/maple
Every Sunday we deconstruct one proprietary app and pick the best open source alternatives worth switching to.
Similar open source projects

Stars
Last commit
License
Stars
Last commit
License
Stars
Last commit
License
 Windshift – The self-hosted platform that replaces Jira.
 c15t
c15t CodeRabbit