Stars
Forks
Last commit
Stars
Forks
Last commit
Stars
Forks
Last commit
Stars
Forks
Last commit
Stars
Forks
Last commit
Stars
Forks
Last commit
Stars
Forks
Last commit
Stars
Forks
Last commit
Stars
Forks
Last commit
Stars
Forks
Last commit
Stars
Forks
Last commit
Stars
Forks
Last commit
The best open source alternative to Splunk is Apache Superset. If that doesn't suit you, we've compiled a ranked list of other open source Splunk alternatives to help you find a suitable replacement. Other interesting open source alternatives to Splunk are: Grafana, SigNoz, ProjectDiscovery, and Redash.
Splunk alternatives are mainly Log Management Tools but may also be Infrastructure Monitoring Tools or Performance Monitoring (APM) Tools. Browse these if you want a narrower list of alternatives or looking for a specific functionality of Splunk.
Connect any SQL database, build charts with drag-and-drop or raw SQL, and publish interactive dashboards without writing application code.
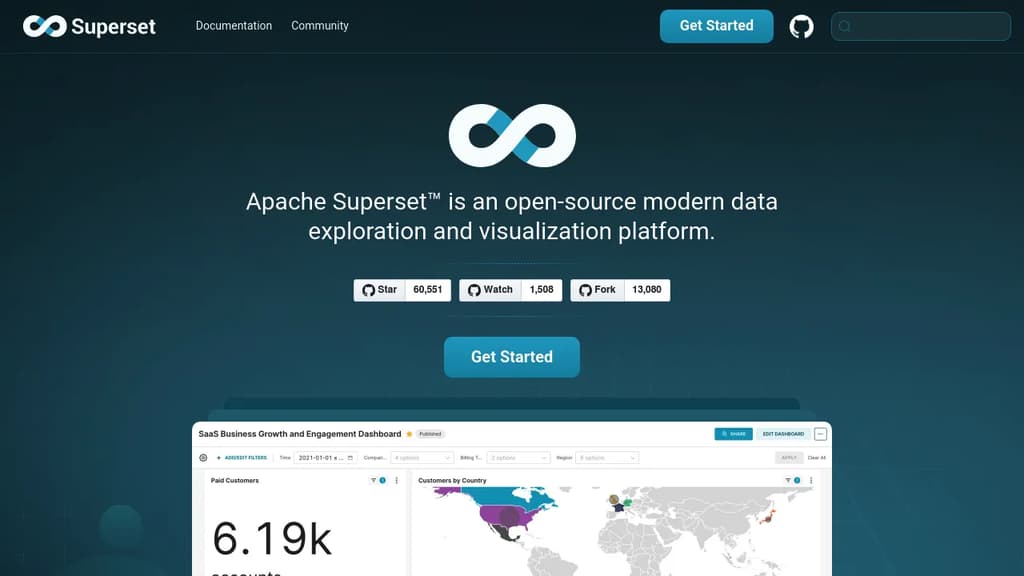
Apache Superset is a data exploration and visualization platform built for teams who want self-serve analytics without depending on a data engineering team for every report. It works with any SQL-based database, from small Postgres instances to petabyte-scale cloud warehouses, and doesn't require a separate data ingestion layer.
The tool serves two kinds of users at once. Analysts who prefer a visual interface can use the drag-and-drop chart builder to assemble dashboards without writing a line of SQL. Those who want more control get SQL Lab, a full-featured SQL IDE with database metadata browsing, Jinja templating, and the ability to save query results as virtual datasets for further exploration.
Key capabilities include:
Compared to lighter tools like Metabase or Redash, Superset leans toward teams that need more customization and are comfortable managing their own deployment. It's self-hostable under the Apache License, which makes it a common choice for organizations that can't send data to a third-party SaaS. Grafana covers similar dashboard territory but focuses heavily on time-series and metrics rather than general SQL exploration.
Superset scales horizontally and is designed to sit on top of your existing data infrastructure rather than replace it.
Grafana is a multi-platform open source analytics and interactive visualization web application that provides charts, graphs, and alerts for the web.
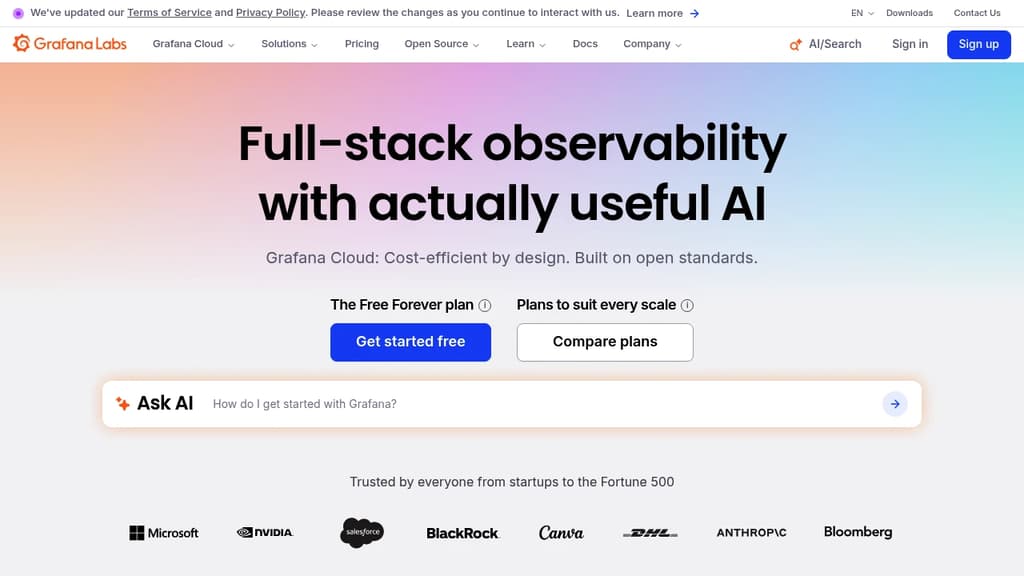
Grafana is a powerful and versatile open-source platform for data visualization and monitoring. It allows users to query, visualize, alert on, and understand metrics no matter where they are stored. Key features include:
Support for multiple data sources: Grafana can connect to various databases and time series data stores, including Prometheus, InfluxDB, Elasticsearch, and many more.
Customizable dashboards: Users can create rich, interactive dashboards with a wide range of visualization options, from simple line graphs to complex heatmaps.
Alerting system: Grafana includes a flexible alerting engine that can notify users when specific conditions are met in their data.
Plugin ecosystem: Extend Grafana's functionality with a wide range of community-contributed and official plugins.
User management and authentication: Grafana offers built-in user authentication and supports various external authentication providers.
Templating and variables: Create dynamic dashboards that adapt to different contexts and data sets.
Grafana is widely used in various industries for monitoring infrastructure, applications, and business metrics. It's known for its flexibility, ease of use, and ability to bring together data from multiple sources into a single, cohesive view.
Comprehensive monitoring and troubleshooting solution for microservices architectures, offering metrics, traces, and logs in a single pane.
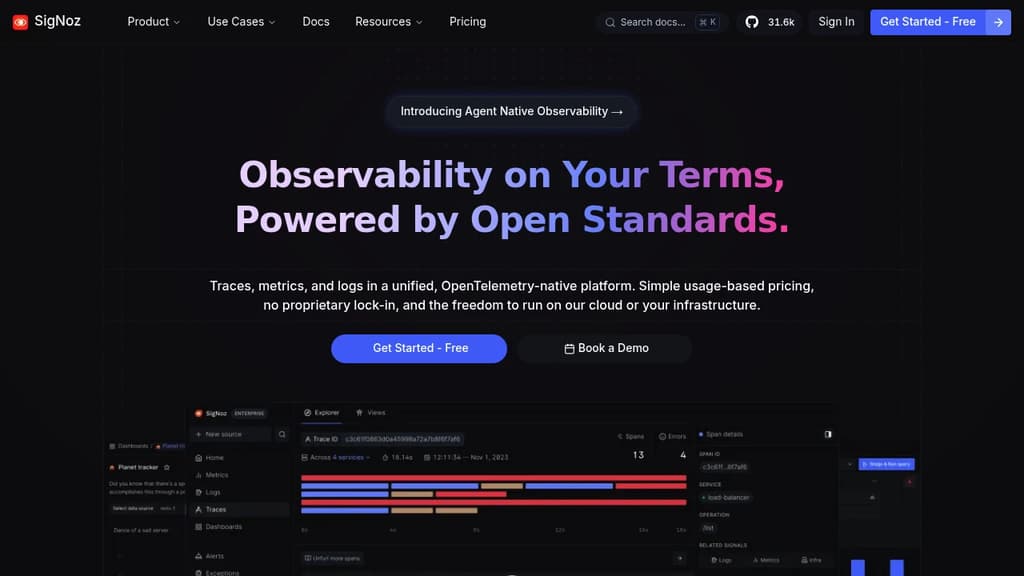
SigNoz is a powerful, open-source observability platform designed for modern, cloud-native applications. It provides a unified solution for monitoring, troubleshooting, and optimizing your microservices architecture.
Key benefits of SigNoz include:
All-in-One Observability: Combine metrics, traces, and logs in a single platform, eliminating the need for multiple tools and reducing context-switching.
Cost-Effective: As an open-source solution, SigNoz offers significant cost savings compared to proprietary alternatives, especially for high-volume data ingestion.
Easy Setup: Get started quickly with a simple installation process and intuitive UI, making it accessible for teams of all sizes.
Customizable Dashboards: Create tailored views of your system's performance with flexible, drag-and-drop dashboard builders.
Distributed Tracing: Gain deep insights into request flows across your microservices, helping you identify bottlenecks and optimize performance.
Anomaly Detection: Leverage built-in anomaly detection capabilities to proactively identify issues before they impact your users.
Scalability: Designed to handle high-volume data ingestion, SigNoz scales effortlessly with your growing infrastructure.
Open Standards: Built on OpenTelemetry, ensuring compatibility with a wide range of technologies and future-proofing your observability stack.
By choosing SigNoz, you're not just adopting a monitoring tool; you're embracing a comprehensive observability solution that grows with your needs and empowers your team to maintain high-performing, reliable applications.
Monitor infrastructure for exploitable vulnerabilities with real-time detection, automated workflows, and zero false positives.
ProjectDiscovery delivers enterprise-grade vulnerability management with a focus on detecting only exploitable vulnerabilities to eliminate false positives. The platform features real-time infrastructure monitoring that provides instant visibility into your entire tech stack as teams deploy.
Key capabilities include:
The platform is trusted by over 100,000 security professionals to transform noisy scan results into relevant, actionable alerts that enable 10x faster vulnerability triage and remediation.
Redash is an open-source data visualization and analytics platform that helps teams make sense of their data through SQL queries and interactive dashboards.
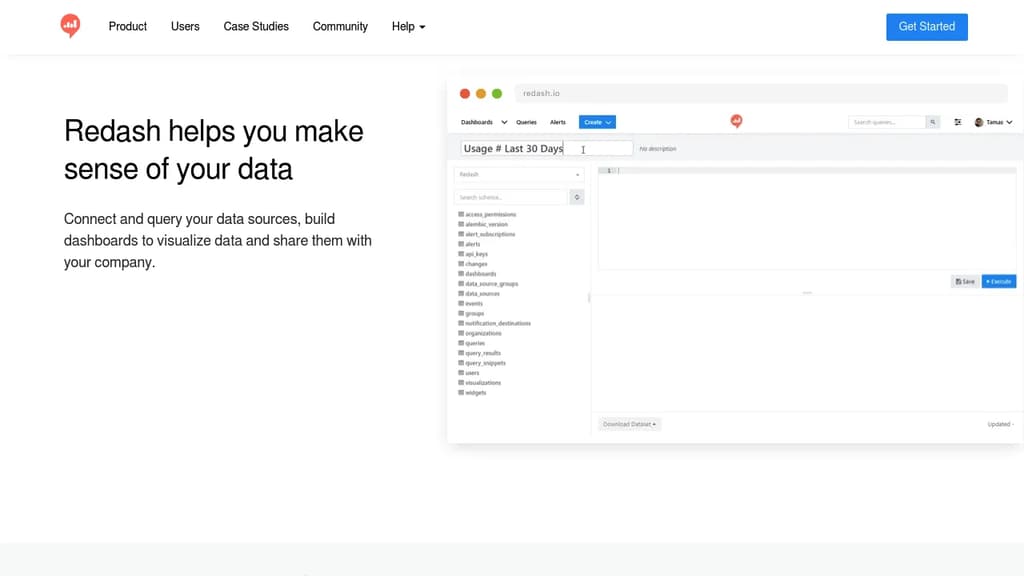
Redash is a powerful, open-source data visualization and analytics platform designed to help teams connect, query, visualize, and share their data effectively. Here's what makes Redash stand out:
Versatile Data Connectivity:
Powerful Query Editor:
Interactive Dashboards:
Collaboration and Sharing:
Visualizations and Alerts:
Open-Source Advantage:
API Access:
Redash is trusted by data-driven companies to make sense of their information, enabling better decision-making and deeper understanding of their data. Whether you're a small startup or a large enterprise, Redash provides the tools you need to turn your data into actionable insights.
Monitor logs, metrics, and traces with an open-source observability platform. Achieve petabyte scale with 140x lower storage costs and high performance.
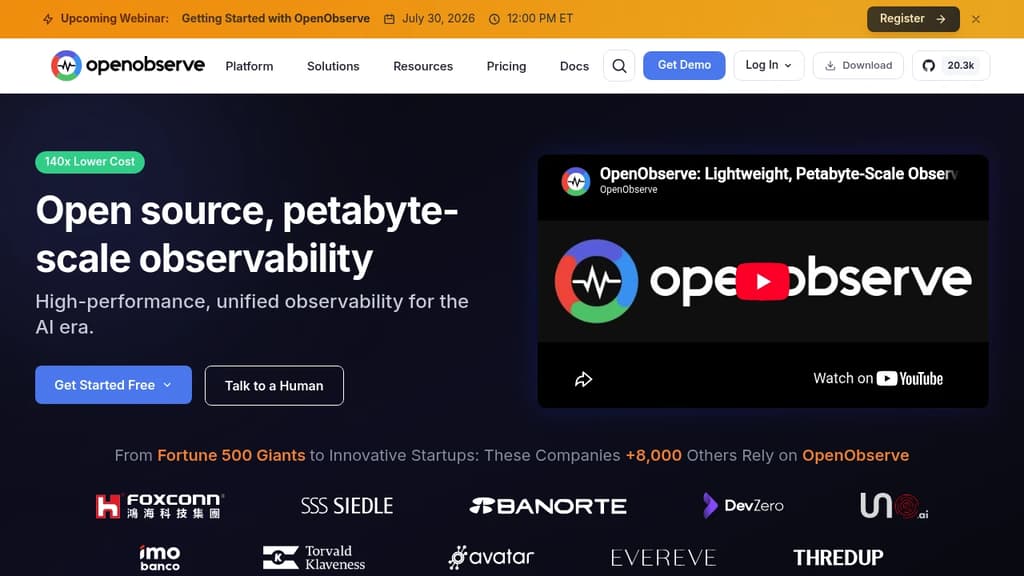
OpenObserve is a comprehensive, open-source observability platform designed for logs, metrics, and traces. It offers a modern, scalable architecture built for high performance and significant cost savings. The platform's primary advantage is its efficiency, providing up to 140x lower storage costs when compared to alternatives like Elasticsearch. This is achieved through high data compression and a columnar storage format.
Key features include:
Logstash is a free and open server-side data processing pipeline that ingests data from multiple sources, transforms it, and sends it to your desired destination.
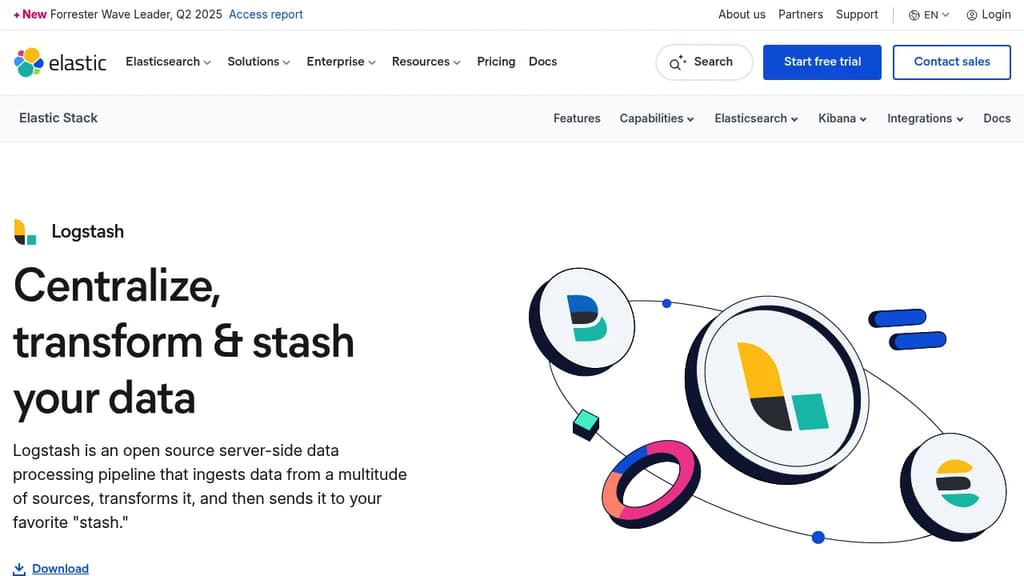
Logstash is a powerful data processing pipeline that allows you to collect, transform, and ship data from various sources to multiple destinations. Here are some key features and benefits:
Versatile Input Support:
Powerful Data Transformation:
Flexible Output Options:
Extensibility:
Reliability and Security:
Monitoring and Management:
Elastic Stack Integration:
Logstash is an essential tool for organizations looking to centralize and process their data efficiently, making it ready for analysis and visualization in platforms like Elasticsearch and Kibana.
Open source observability platform unifying session replays, logs, traces, metrics and errors. Fast search, automatic clustering, $0.40/GB pricing.

Open source observability platform that unifies session replays, logs, traces, metrics and errors into a single view - all without the expensive Datadog price tag. Recently acquired by ClickHouse to accelerate open source observability innovation.
Key capabilities include:
Developer-friendly features:
Transparent pricing at $0.40 per GB with no per-user or per-host fees makes enterprise-grade observability accessible to teams of all sizes. Trusted by high-velocity engineering teams for resolving production issues fast.
Open-source observability platform for LLMs using OpenTelemetry. Monitor performance, track costs, and debug AI applications with just 2 lines of code.

Monitor and optimize your LLM applications with comprehensive observability built on OpenTelemetry standards. This open-source platform provides deep insights into your AI systems with minimal setup complexity.
Key capabilities include:
Quick integration requires just 2 lines of code to start collecting telemetry data. Built on OpenTelemetry standards, ensuring compatibility with existing monitoring infrastructure and avoiding vendor lock-in.
Perfect for developers building production LLM applications who need reliable monitoring without complex setup or proprietary dependencies.
Coroot simplifies system monitoring by providing metrics, logs, traces, and profiling with zero instrumentation, leveraging eBPF technology.
Coroot is an innovative open-source observability platform that revolutionizes how developers and operations teams monitor and troubleshoot their systems. Here's what makes Coroot stand out:
Zero-instrumentation observability:
Comprehensive monitoring features:
User-friendly interface:
Built-in expertise:
Deployment and cost monitoring:
Open-source and cloud options:
Coroot simplifies the complex task of system observability, making it accessible to teams of all sizes. By leveraging cutting-edge technologies and providing a user-friendly interface, Coroot enables faster debugging, better development practices, and improved system reliability.
Cloud-native observability database unifying metrics, logs, and traces with sub-second queries, 50x cost reduction, and seamless OpenTelemetry integration.
GreptimeDB is a cloud-native, real-time observability database that revolutionizes how organizations handle metrics, logs, and traces. Built for OpenTelemetry and modern cloud environments, it delivers sub-second query performance at petabyte scale while dramatically reducing operational complexity.
Key benefits include:
Trusted by companies like Li Auto (reduced traffic costs by 50%, storage costs by 98%), SGCC (2x write performance, 5x query performance), and others who have migrated from InfluxDB, Loki, and Thanos to achieve superior performance and simplified operations.
Open-source platform for logging, monitoring, and debugging LLM applications. Route, debug, and analyze AI apps with comprehensive observability tools.
Helicone is the open-source platform that helps developers build reliable AI applications through comprehensive observability. Trusted by the world's fastest-growing AI companies, it provides essential tools for routing, debugging, and analyzing LLM applications.
Key Features:
The platform offers a comprehensive dashboard for monitoring AI application performance, with detailed request tracking and user analytics. Developers can experiment with prompts, run evaluations, and manage datasets all within one unified interface.
Getting Started: No credit card required with a 7-day free trial. The platform is designed to help developers quickly identify issues, optimize performance, and ensure their AI applications run reliably at scale.
Sub-second SQL queries on fresh streaming data at petabyte scale, built for high-concurrency user-facing apps and AI agent backends.
Apache Pinot is a distributed OLAP database built for real-time analytics where latency and concurrency actually matter. Originally developed at LinkedIn, it's now used by Stripe, Uber, Walmart, and others to serve analytical queries at hundreds of thousands of requests per second, often with P99 latencies under 100ms.
The core use case: you have streaming data and you need to query it interactively, at scale, without pre-aggregating everything in advance. Pinot handles that through columnar storage, a rich set of pluggable indexes, and a distributed architecture that scales horizontally.
Key capabilities:
Pinot fits two broad patterns. First, user-facing analytics: embedded dashboards, customer-facing data exploration, leaderboards, and usage metrics where your product's users are running queries in real time. Second, AI agent backends: LLM-powered systems that need fresh context from streaming data rather than stale snapshots. Think fraud scoring, real-time RAG retrieval, or agentic observability over live logs.
Compared to tools like ClickHouse, Pinot's design leans heavily toward serving many concurrent external users rather than fewer internal analysts running complex ad-hoc queries. The trade-off is intentional. Pinot's indexing options (inverted, range, text, geospatial, and more) let you tune for specific query patterns without restructuring your data model.
At Stripe, it handles 200K queries per second across 3 petabytes with P99 latency of 70ms. At Uber, a single service runs 500 million Pinot queries daily. These aren't edge cases; the architecture is built around this kind of load from the start.
Logfire offers intuitive observability tools for Python applications, combining logs, profiling, and telemetry in one platform.
Logfire brings powerful observability to Python applications with remarkable simplicity. Built by the team behind Pydantic, it offers developers an intuitive way to gain deep insights into their code.
Key features:
Logfire transforms complex observability tasks into actionable insights. Whether you're building AI tools or cloud-based applications, it provides a clear window into your code's behavior. With features like performance profiling and full execution tracing, Logfire helps developers quickly identify and resolve issues.
The platform's intuitive design makes it accessible for teams of all sizes, eliminating the need for dedicated observability experts. By combining ease of use with powerful analytics capabilities, Logfire empowers developers to make data-driven decisions and continuously improve their applications.
Tracecat is a scalable, self-hostable platform for automating security workflows and playbooks without limits.

Tracecat is an open source alternative to proprietary security orchestration, automation and response (SOAR) platforms like Tines and Splunk SOAR. It empowers security engineers to automate their workflows and playbooks without restrictions.
Key features:
Tracecat allows security teams to automate alert triage, threat enrichment, incident response and more. The platform scales to handle high volumes of workflows in parallel across isolated tenants. With both no-code and code-based options, it provides flexibility for teams of all technical levels.
By offering an open source alternative to proprietary SOAR tools, Tracecat aims to make powerful security automation accessible to more organizations. The self-hosted deployment model ensures sensitive security data and workflows remain under your control.
Uptrace is an OpenTelemetry-based platform that integrates traces, metrics, and logs to help monitor and optimize complex distributed systems.
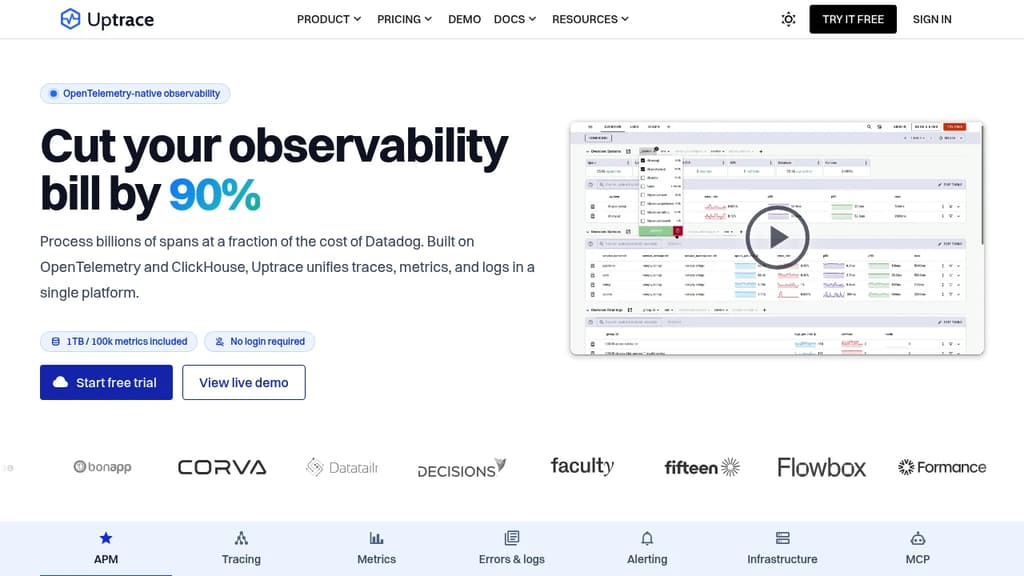
Uptrace is an open-source observability platform built on OpenTelemetry, designed to help developers and operations teams monitor, understand, and optimize complex distributed systems. It offers a comprehensive solution for application performance monitoring (APM) with integrated tracing, metrics, and logging capabilities.
Key features and benefits:
All-in-one solution:
Flexible deployment options:
Cost-effective and predictable pricing:
OpenTelemetry integration:
Comprehensive monitoring dashboard:
Scalability:
Incident response:
By offering a unified platform for observability, Uptrace simplifies the monitoring process and provides valuable insights into application performance, helping teams optimize their systems and respond to incidents more effectively.
Monitor your entire IT infrastructure with 2,000+ plugins, automated discovery, and scalable architecture. Open source and enterprise solutions available.
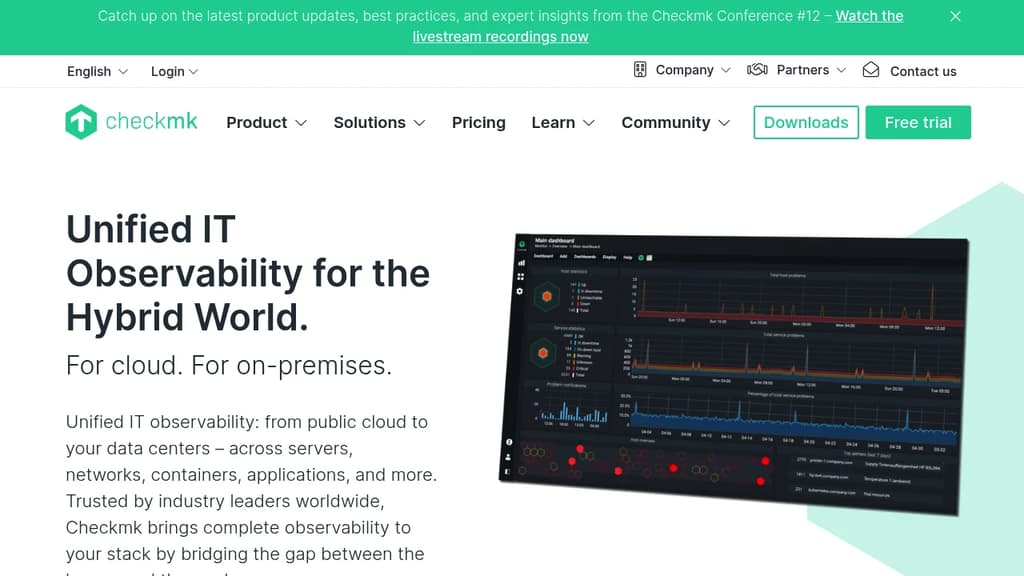
Comprehensive IT monitoring that scales from small teams to enterprise environments with millions of services. Checkmk automatically discovers and monitors your entire infrastructure - from cloud providers to data centers, servers, networks, containers, and applications.
Key advantages include:
Multiple deployment options cater to different needs:
Advanced features include dynamic dashboards, business intelligence mapping, custom self-healing actions, and comprehensive SLA reporting. The platform combines infrastructure monitoring with log analysis, synthetic testing capabilities, and historical performance forecasting to provide complete visibility into your IT operations.
Unified platform for logs, metrics, traces and profiles with native compatibility for popular tools like OpenTelemetry, Prometheus, and Loki. No data silos, no usage limits.
A powerful observability platform that brings together logs, metrics, traces and profiles in one unified solution. Built on high-performance OLAP engines ClickHouse and DuckDB with NVMe storage, Gigapipe delivers exceptional speed and reliability.
Key advantages:
Perfect for engineering teams and DevOps professionals who need comprehensive observability without the complexity of managing multiple tools or worrying about data volume costs. Gigapipe's polyglot approach ensures you can work with your data your way, while the unified platform enables quick correlation between different data types for faster troubleshooting and deeper insights.

The leading AI Code Review platform. Ship better quality code in 50% less time, with 90% fewer bugs.
Try it for free
Capture screenshots, generate PDFs, scrape content, extract metadata, and automate browsers with one API.
Get free credits
Messaging Infrastructure for Developers. One API for SMS, WhatsApp, and RCS across 190+ countries.
Get Started Free Sevalla