Grafana
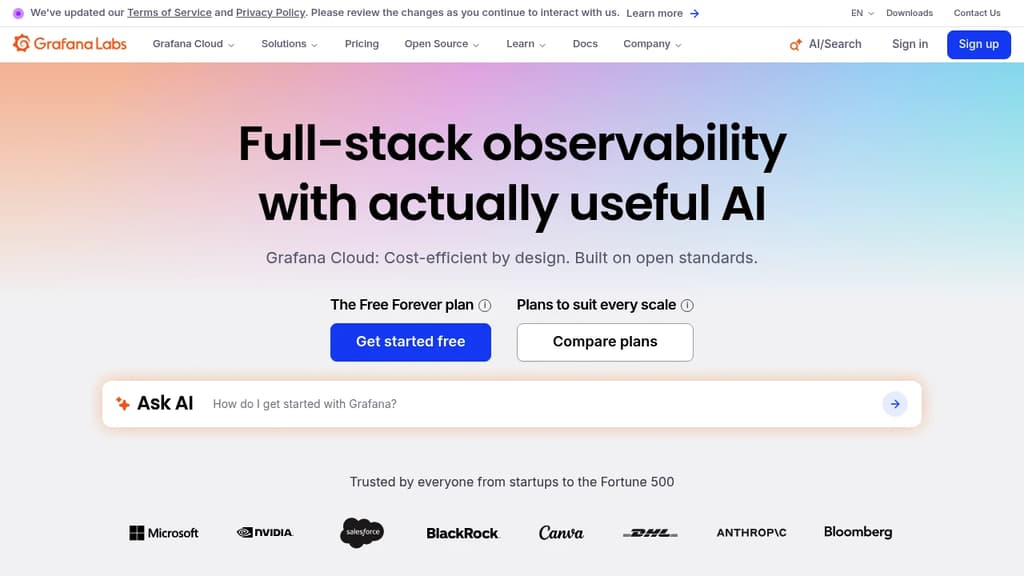
Grafana unifies metrics, logs, traces, profiles, and business data into one OpenTelemetry-native platform with AI-assisted root cause analysis and adaptive cost controls.




Last 30 days
Last commit
8 hours agoRepository age
13 yearsVersion
v13.2.4License
AGPL-3.0Self-hosted
YesRepository
grafana/grafana
- 1
Start a KVM 2 VPS on Hostinger
Recommended plan for one-click apps.
- 2
Apply code
10% off any 12-month plan at checkout.
- 3
Deploy Grafana
With Hostinger's one-click installer.
 Host with Hostinger
Grafana is a self-hosted observability platform built on open standards like OpenTelemetry and Prometheus. It brings together metrics, logs, traces, profiles, and business data into a single view, so engineering and SRE teams can troubleshoot across their entire stack without jumping between tools.
It's built for teams that want the flexibility of open source without the overhead of managing infrastructure themselves. Hundreds of plugins and integrations let you connect existing data sources rather than replacing them.
Key capabilities include:
- Adaptive Telemetry automatically identifies high-value data and aggregates the rest, cutting telemetry costs by up to 80% without manual filtering rules
- AI-assisted analysis helps interpret production telemetry and accelerate root cause analysis, plus tooling to evaluate and monitor production AI agents
- Unified signal map correlates metrics, logs, and traces so teams can move from alert to fix without context-switching
- Incident response and synthetic monitoring built in, covering the full reliability workflow rather than just data collection
- Compliance certifications including FedRAMP, PCI DSS, SOC Type II, and GDPR, making it viable for regulated industries
Compared to alternatives like Dynatrace or Coralogix, Grafana's differentiator is its open-source foundation. The core Grafana stack is community-driven, and the cloud product extends it with managed infrastructure, enterprise features, and cost controls. You're not locked into proprietary agents or data formats.
For teams already using OpenObserve or Uptrace and considering a managed path, Grafana Cloud offers a broader feature surface with the same commitment to open standards. A free tier is available with no time limit, and paid plans scale with usage.
Tags:











Last 30 days
Last commit
8 hours agoRepository age
13 yearsVersion
v13.2.4License
AGPL-3.0Self-hosted
YesRepository
grafana/grafana
- 1
Start a KVM 2 VPS on Hostinger
Recommended plan for one-click apps.
- 2
Apply code
10% off any 12-month plan at checkout.
- 3
Deploy Grafana
With Hostinger's one-click installer.
Host with HostingerEvery Sunday we deconstruct one proprietary app and pick the best open source alternatives worth switching to.
Similar open source projects

Stars
Last commit
License
Stars
Last commit
License
Stars
Last commit
License
 c15t – Open-source cookie banner, built for control and lightening fast modern web apps.
 Sent
Sent CodeRabbit