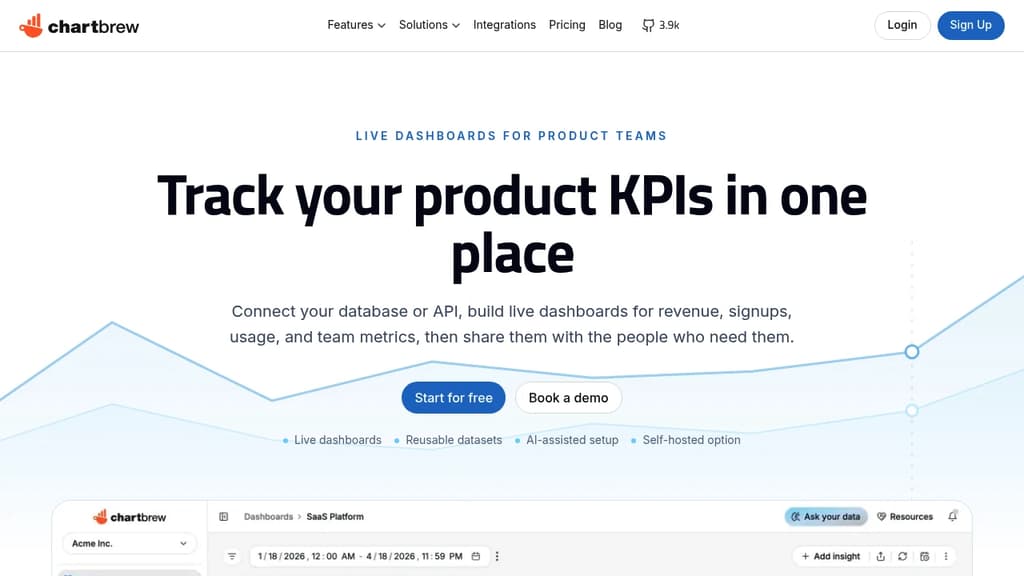
Chartbrew is a game-changing solution for data visualization enthusiasts and professionals alike. This versatile platform empowers users to create beautiful, interactive dashboards and charts without writing a single line of code.
Key benefits of Chartbrew include:
Whether you're a business analyst, data scientist, or simply someone who wants to make sense of complex data, Chartbrew provides the tools you need to transform raw information into compelling visual stories. Start brewing your data-driven insights today with Chartbrew!
Activity score
Stars
Forks
Last commit
Activity score
Stars
Forks
Last commit
Repository age
Every Sunday we deconstruct one proprietary app and pick the best open source alternatives worth switching to.

Stars
Forks
Last commit
Stars
Forks
Last commit
Stars
Forks
Last commit
Repository age
Version
License
Self-hosted
Repository
License
Self-hosted
Repository
 Sent
SentStars
Forks
Last commit
Compare with
Stars
Forks
Last commit
Compare with
Stars
Forks
Last commit
Compare with
Stars
Forks
Last commit
Compare with
Stars
Forks
Last commit
Compare with
Stars
Forks
Last commit
Compare with
Stars
Forks
Last commit
Compare with
Stars
Forks
Last commit
Compare with


 Docmost