Open Source Lightdash Alternatives
A curated collection of the 8 best open source alternatives to Lightdash.
The best open source alternative to Lightdash is OpenBB. If that doesn't suit you, we've compiled a ranked list of other open source Lightdash alternatives to help you find a suitable replacement. Other interesting open source alternatives to Lightdash are: Apache Superset, Metabase, Redash, and Evidence.
Lightdash alternatives are mainly BI Platforms but may also be Data Visualization Tools or Financial Data Platforms. Browse these if you want a narrower list of alternatives or looking for a specific functionality of Lightdash.

Written by Piotr Kulpinski


Connects proprietary, licensed, and public financial data with AI agents in a self-hostable workspace for asset managers, hedge funds, and banks.
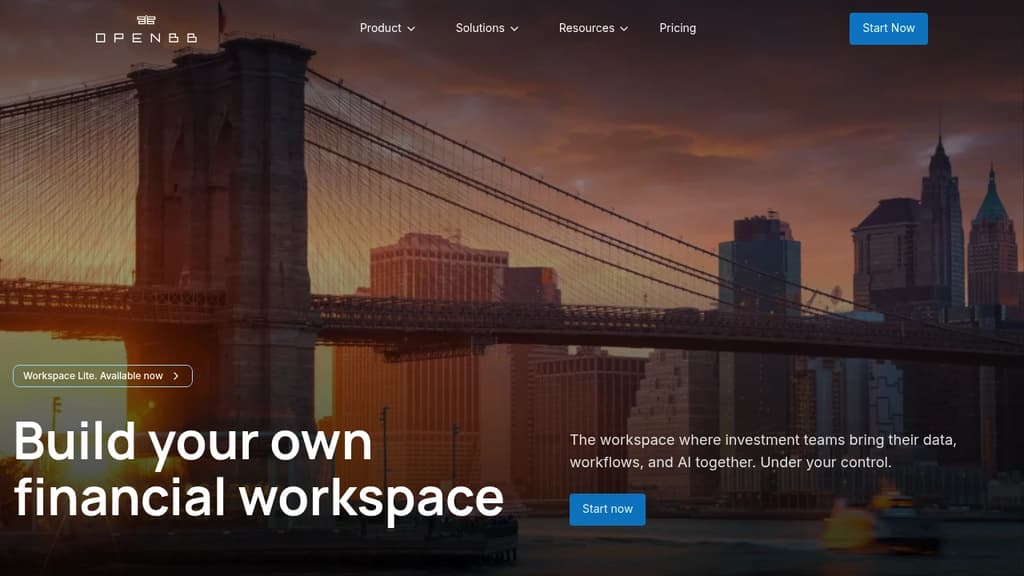
OpenBB is an agentic workspace designed for investment teams that need to bring fragmented data sources and AI tools together without building custom infrastructure from scratch. It targets asset managers, hedge funds, and banks that want production-ready analytics applications without months of engineering work.
The core idea is straightforward: your firm already has proprietary data, licensed feeds, and internal tools. OpenBB provides the layer that connects all of it, structured and unstructured alike, and makes it available to AI agents in a controlled, auditable environment. Think of it as an alternative to tools like Hebbia but built around a fully self-hostable, open-source foundation.
Key capabilities include:
- Data integration across proprietary, licensed, and public sources, both structured (market data, financials) and unstructured (filings, transcripts, emails)
- Bring your own agent support, so teams can plug in their own AI models rather than being locked into a single provider
- Customizable UI that adapts to specific workflows and supports team collaboration
- On-prem or private cloud deployment, with no data leaving your environment and no third-party model training on your positions
- SOC 2 Type II compliance, giving compliance teams the controls they need
Workflows span public equity research, private equity due diligence, credit risk, crypto analysis, commodities, and client advisory. Analysts can automate earnings intelligence extraction, generate investment notes from call transcripts, run portfolio stress tests, and draft investor letters, all from a single interface.
For teams already experimenting with AI agent frameworks or workflow automation, OpenBB provides the finance-specific context layer those tools lack. The workspace is designed for experimentation and production deployment simultaneously, so prototypes don't need to be rebuilt before going live.
Data privacy is a genuine differentiator here. AI models can run locally, prompts stay inside your environment, and your positions never touch an external training pipeline.

Connect any SQL database, build charts with drag-and-drop or raw SQL, and publish interactive dashboards without writing application code.
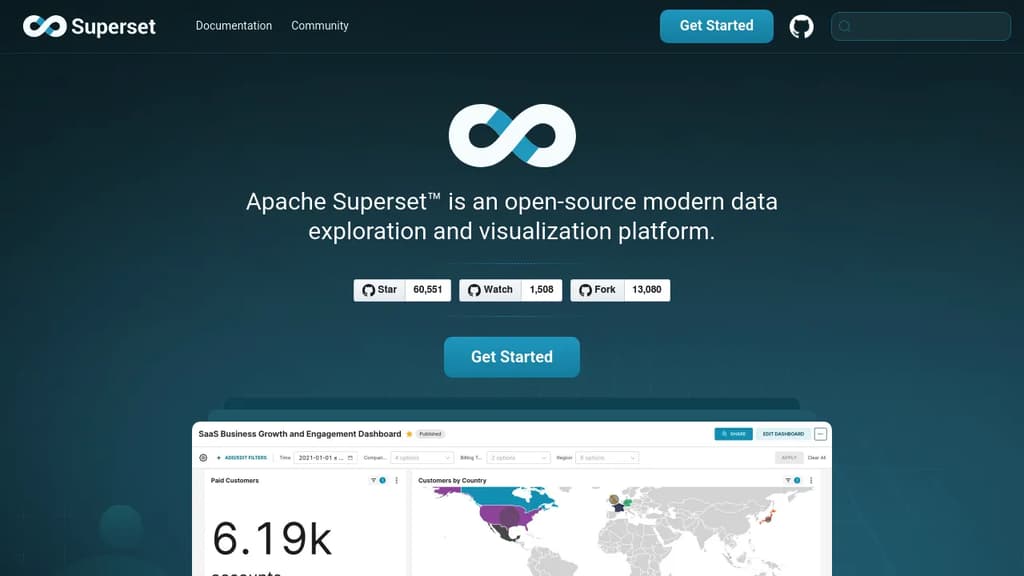
Apache Superset is a data exploration and visualization platform built for teams who want self-serve analytics without depending on a data engineering team for every report. It works with any SQL-based database, from small Postgres instances to petabyte-scale cloud warehouses, and doesn't require a separate data ingestion layer.
The tool serves two kinds of users at once. Analysts who prefer a visual interface can use the drag-and-drop chart builder to assemble dashboards without writing a line of SQL. Those who want more control get SQL Lab, a full-featured SQL IDE with database metadata browsing, Jinja templating, and the ability to save query results as virtual datasets for further exploration.
Key capabilities include:
- 40+ built-in chart types, from basic line and bar charts to geospatial visualizations
- Virtual and physical datasets with unified metric definitions, so the same numbers appear consistently across dashboards
- Cross-filters, drill-to-detail, and drill-by for interactive data analysis directly in a dashboard
- Data caching to keep dashboards fast without re-querying the database on every load
- CSS templates for matching charts to your brand
- Semantic layer for SQL-based data transformations before visualization
- Plugin architecture for adding custom chart types beyond the built-in set
Compared to lighter tools like Metabase or Redash, Superset leans toward teams that need more customization and are comfortable managing their own deployment. It's self-hostable under the Apache License, which makes it a common choice for organizations that can't send data to a third-party SaaS. Grafana covers similar dashboard territory but focuses heavily on time-series and metrics rather than general SQL exploration.
Superset scales horizontally and is designed to sit on top of your existing data infrastructure rather than replace it.

Open-source business intelligence platform for data exploration, visualization, and sharing. Empowers teams to make data-driven decisions effortlessly.
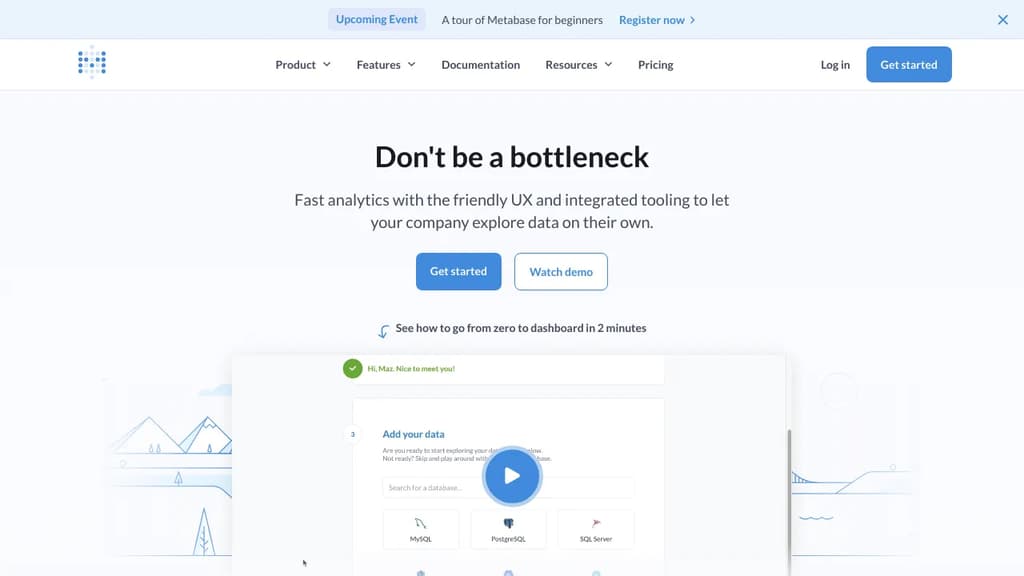
Metabase is an open-source business intelligence and analytics platform that transforms how organizations interact with their data. It offers a seamless blend of power and simplicity, making it an ideal choice for companies of all sizes.
Key benefits of Metabase include:
- Intuitive Interface: Easy-to-use dashboard creation and data exploration tools, enabling users of all skill levels to gain insights quickly.
- Versatile Connectivity: Supports a wide range of databases and data sources, allowing you to centralize your data analysis efforts.
- Powerful Visualization: Create stunning charts, graphs, and interactive dashboards to communicate complex data effectively.
- Collaborative Features: Share insights across your organization with ease, fostering a data-driven culture.
- Customizable and Extensible: Tailor Metabase to your specific needs with custom visualizations and integrations.
- Secure and Scalable: Enterprise-grade security features and the ability to handle large datasets make Metabase suitable for growing organizations.
- Active Community: Benefit from a vibrant open-source community, regular updates, and extensive documentation.
Whether you're a small startup or a large enterprise, Metabase provides the tools you need to turn your data into actionable insights, driving informed decision-making across your organization.

Redash is an open-source data visualization and analytics platform that helps teams make sense of their data through SQL queries and interactive dashboards.
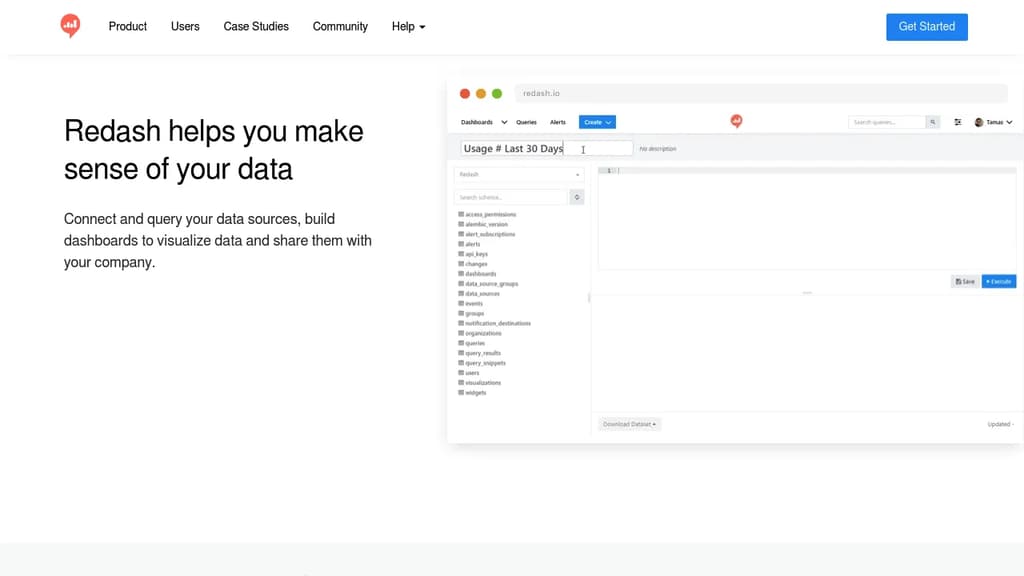
Redash is a powerful, open-source data visualization and analytics platform designed to help teams connect, query, visualize, and share their data effectively. Here's what makes Redash stand out:
-
Versatile Data Connectivity:
- Supports a wide range of data sources, including SQL, NoSQL, Big Data, and APIs
- Allows querying from multiple sources to answer complex questions
-
Powerful Query Editor:
- Intuitive SQL editor with schema browsing and click-to-insert functionality
- Ability to create and reuse query snippets for efficiency
-
Interactive Dashboards:
- Drag-and-drop interface for creating customizable dashboards
- Resize and arrange visualizations to suit your needs
- Schedule automatic refreshes from data sources
-
Collaboration and Sharing:
- Share dashboards with team members or make them public
- User management features for access control
-
Visualizations and Alerts:
- Create various types of visualizations to represent your data
- Set up alerts to stay informed about important data changes
-
Open-Source Advantage:
- Customize and add features to suit your specific needs
- No vendor lock-in
- Active community for support and contributions
-
API Access:
- Integrate Redash with other tools and services using its API
Redash is trusted by data-driven companies to make sense of their information, enabling better decision-making and deeper understanding of their data. Whether you're a small startup or a large enterprise, Redash provides the tools you need to turn your data into actionable insights.

Create data-driven websites and reports using SQL and Markdown, with automatic visualizations and interactive elements.
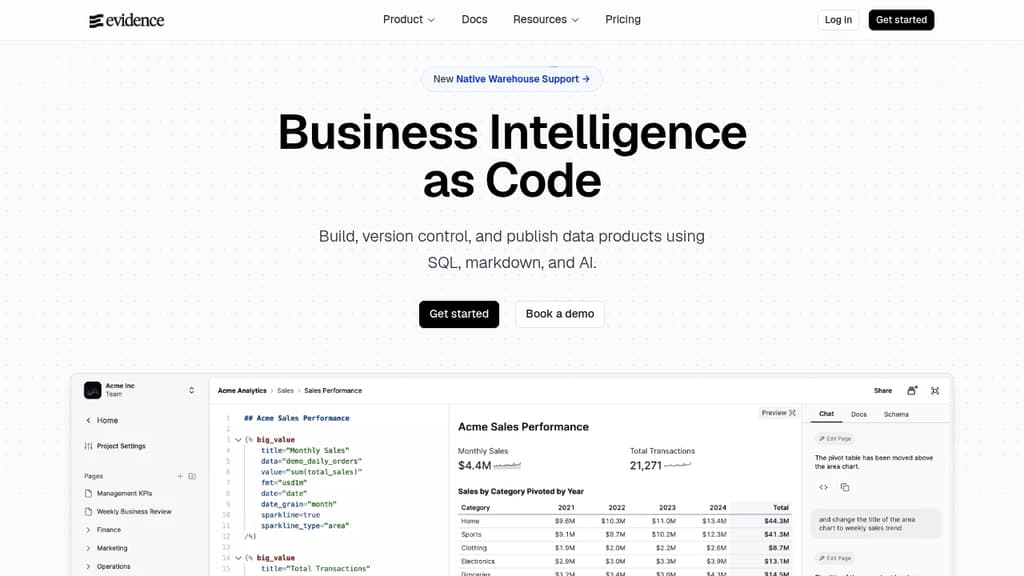
Evidence is a powerful open-source tool that bridges the gap between data analysis and presentation. It allows you to create stunning, interactive data stories and reports directly from your SQL queries and Markdown files.
Key benefits of Evidence include:
- SQL-driven insights: Write SQL queries to extract data from your database, and Evidence automatically generates visualizations and tables.
- Markdown simplicity: Use familiar Markdown syntax to structure your reports and add context to your data.
- Automatic visualizations: Evidence intelligently chooses the best chart type for your data, saving time and effort in creating impactful visuals.
- Interactive elements: Add filters, parameters, and drill-downs to create engaging, exploratory experiences for your audience.
- Version control friendly: Store your reports as code, enabling easy collaboration and change tracking with tools like Git.
- Customizable design: Tailor the look and feel of your reports with CSS and custom components to match your brand.
- Self-hosted solution: Deploy Evidence on your own infrastructure for complete control over your data and reports.
Whether you're a data analyst, business intelligence professional, or developer, Evidence empowers you to create professional-grade data presentations without the need for complex BI tools or web development expertise.

A powerful, open-source platform for building interactive dashboards and charts from multiple data sources without coding.
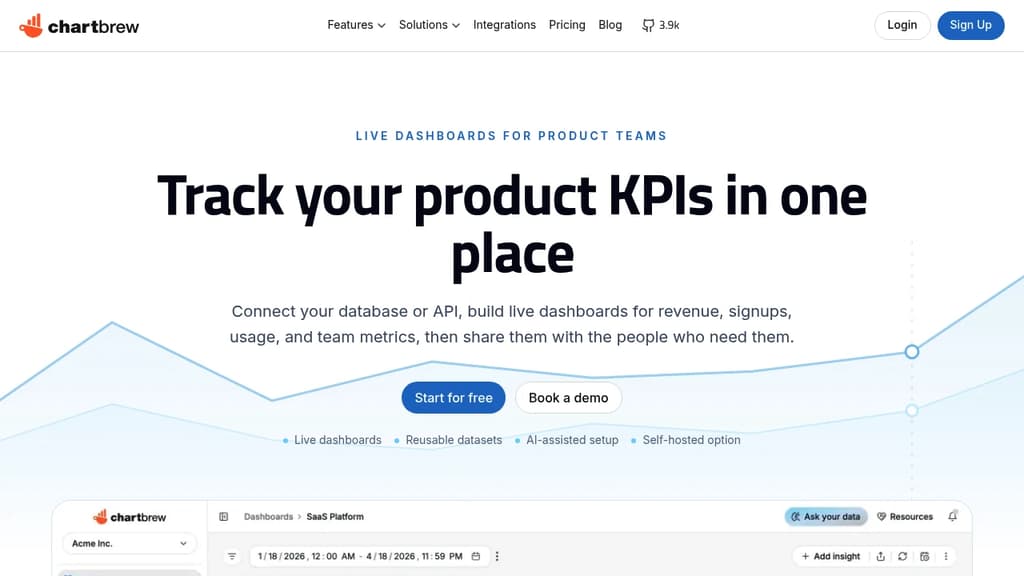
Chartbrew is a game-changing solution for data visualization enthusiasts and professionals alike. This versatile platform empowers users to create beautiful, interactive dashboards and charts without writing a single line of code.
Key benefits of Chartbrew include:
- Intuitive Interface: Easily connect to various data sources and design charts with a user-friendly drag-and-drop interface.
- Multiple Data Sources: Integrate data from databases, APIs, and file uploads to create comprehensive visualizations.
- Real-time Updates: Keep your charts and dashboards current with automatic data refreshes and live updates.
- Customization Options: Tailor your visualizations with a wide range of chart types, color schemes, and layout options.
- Team Collaboration: Share and collaborate on projects with team members, ensuring everyone has access to crucial insights.
- Responsive Design: Create dashboards that look great on any device, from desktop to mobile.
- Open-source Flexibility: Benefit from community contributions and the ability to self-host or modify the platform to suit your needs.
Whether you're a business analyst, data scientist, or simply someone who wants to make sense of complex data, Chartbrew provides the tools you need to transform raw information into compelling visual stories. Start brewing your data-driven insights today with Chartbrew!

Deepnote is an open-source collaborative notebook for data analysts and scientists, combining Python, SQL, AI assistance, and live sharing in one cloud platform.
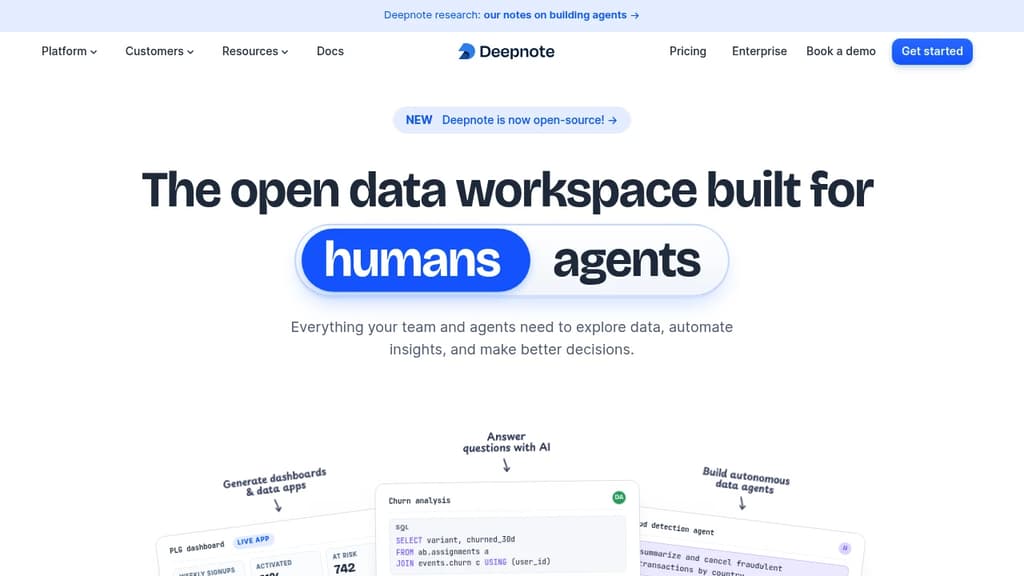
Deepnote is a cloud-based data notebook built for teams. It combines Python, SQL, and R in a single environment, adds AI that understands your codebase and data stack, and makes real-time collaboration as straightforward as sharing a link. It's now fully open-source under Apache 2.0, making it a credible alternative to tools like Hex or hosted Jupyter setups.
The AI layer goes beyond code completion. Deepnote's assistant is aware of your schema, your existing code, and your business context. It can generate queries, explain results, debug errors, and surface drivers behind a metric shift. You describe what you want to find; it writes the analysis. For teams without dedicated data engineers, that matters.
Beyond notebooks, Deepnote covers a surprising range of output types:
- Dashboards and data apps built directly from notebook outputs, with custom layouts and input controls
- Scheduled notebooks that run hourly, daily, or on any cadence you set
- API deployment so models or queries can be served as live endpoints
- GPU compute for ML workloads, selectable from the environment settings
- Data agents that can plan, query, train, and publish results autonomously
SQL is a first-class citizen here, not an afterthought. You can query warehouses directly in SQL blocks, use dbt metadata and Jinja templating, and mix SQL and Python in the same notebook. Connections to Snowflake, BigQuery, Spark, and other major sources are built in. For natural language querying fans, the AI layer can write the SQL for you.
Collaboration works like a shared document. Multiple people can edit simultaneously, comment on individual blocks, and review changes. Sharing externally is a single link or email invite, with RBAC and SSO available for teams that need tighter access control. Deepnote is HIPAA, SOC 2, and GDPR compliant.
You can start locally in VS Code using the Deepnote extension and push to the cloud when you need more compute or want to share results. Over 500,000 data professionals use it, including teams at 96 of the top 100 universities. For open-source notebook users who've outgrown plain Jupyter, it's a well-rounded step up.

Connect multiple data sources, build complex queries, create insightful visualizations, and organize powerful dashboards to make informed business decisions.
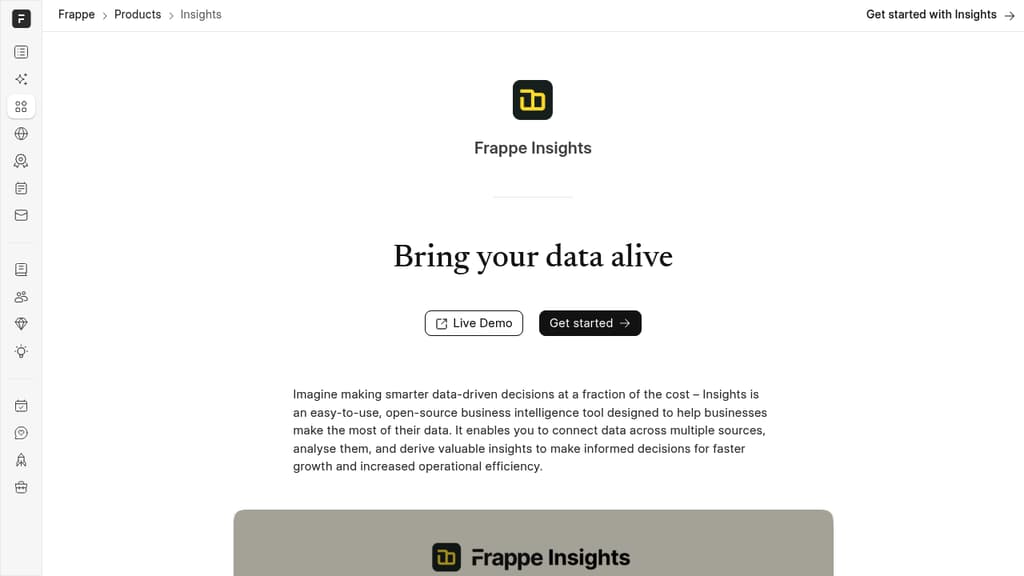
Frappe Insights is a comprehensive open-source business intelligence tool that transforms how organizations handle their data analytics needs.
Key features include:
- Multi-source Data Integration: Seamlessly connect and merge data from various spreadsheets and databases into a single system
- Intuitive Query Builder: Create complex queries without heavy coding using filters, joins, and pivot tables
- Advanced Visualization: Generate meaningful charts and graphs with customizable options and automated chart suggestions
- Dynamic Dashboards: Organize visualizations into interactive dashboards with real-time updates and filtering capabilities
- Collaboration Tools: Share insights across your organization with shareable dashboards and automated alerts
The platform is designed to help businesses overcome the challenge of scattered data by providing a unified solution for data analysis. Its user-friendly interface makes complex data operations accessible to both technical and non-technical users, enabling teams to make data-driven decisions more efficiently.

People are looking for alternatives to...
View all alternatives
Spotify

Claude Code

CapCut

Claude

Notion

Lovable
 Sent – Messaging Infrastructure for Developers. One API for SMS, WhatsApp, and RCS across 190+ countries.

 Stellar Hosted