Open Source VictoriaMetrics Alternatives
A curated collection of the 6 best open source alternatives to VictoriaMetrics.
The best open source alternative to VictoriaMetrics is Grafana. If that doesn't suit you, we've compiled a ranked list of other open source VictoriaMetrics alternatives to help you find a suitable replacement. Other interesting open source alternatives to VictoriaMetrics are: Prometheus, SigNoz, TimescaleDb, and GreptimeDB.
VictoriaMetrics alternatives are mainly Infrastructure Monitoring Tools but may also be Performance Monitoring (APM) Tools or Time Series Databases. Browse these if you want a narrower list of alternatives or looking for a specific functionality of VictoriaMetrics.

Written by Piotr Kulpinski


Grafana unifies metrics, logs, traces, profiles, and business data into one OpenTelemetry-native platform with AI-assisted root cause analysis and adaptive cost controls.
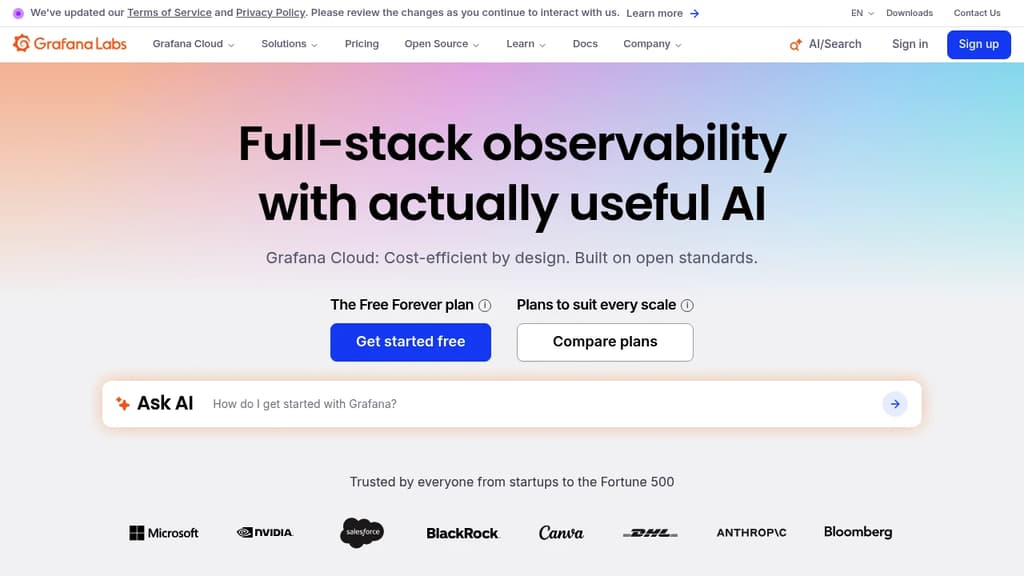
Grafana is a self-hosted observability platform built on open standards like OpenTelemetry and Prometheus. It brings together metrics, logs, traces, profiles, and business data into a single view, so engineering and SRE teams can troubleshoot across their entire stack without jumping between tools.
It's built for teams that want the flexibility of open source without the overhead of managing infrastructure themselves. Hundreds of plugins and integrations let you connect existing data sources rather than replacing them.
Key capabilities include:
- Adaptive Telemetry automatically identifies high-value data and aggregates the rest, cutting telemetry costs by up to 80% without manual filtering rules
- AI-assisted analysis helps interpret production telemetry and accelerate root cause analysis, plus tooling to evaluate and monitor production AI agents
- Unified signal map correlates metrics, logs, and traces so teams can move from alert to fix without context-switching
- Incident response and synthetic monitoring built in, covering the full reliability workflow rather than just data collection
- Compliance certifications including FedRAMP, PCI DSS, SOC Type II, and GDPR, making it viable for regulated industries
Compared to alternatives like Dynatrace or Coralogix, Grafana's differentiator is its open-source foundation. The core Grafana stack is community-driven, and the cloud product extends it with managed infrastructure, enterprise features, and cost controls. You're not locked into proprietary agents or data formats.
For teams already using OpenObserve or Uptrace and considering a managed path, Grafana Cloud offers a broader feature surface with the same commitment to open standards. A free tier is available with no time limit, and paid plans scale with usage.

Pull-based monitoring system with a multi-dimensional data model, PromQL query language, built-in alerting, and a time series database built for cloud native environments.
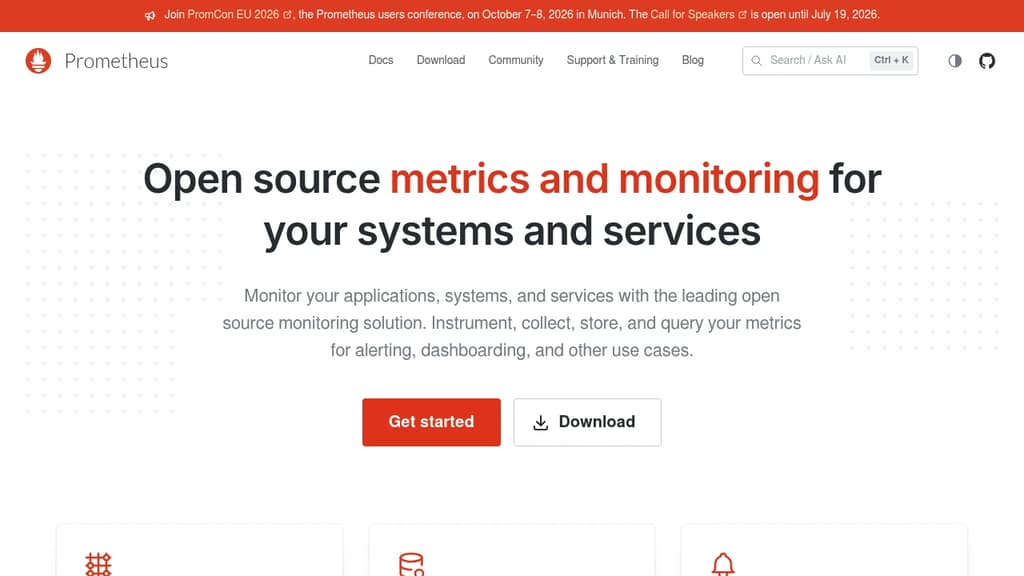
Prometheus is the de facto standard for open source infrastructure monitoring. It collects metrics from your applications, systems, and services, stores them as time series data, and lets you query, visualize, and alert on that data. Originally inspired by Google's internal Borgmon system, it's now a graduated CNCF project (the second after Kubernetes) with a large community behind it.
The core model is pull-based: Prometheus scrapes metrics from instrumented targets at configurable intervals. This makes it straightforward to see exactly what's being collected and when. Targets can be defined statically or discovered automatically, which is where its Kubernetes integration shines. It continuously discovers pods, services, and nodes as they come and go, so you don't have to manually update your monitoring config every time your infrastructure changes.
Key capabilities:
- PromQL: a flexible query language for slicing and aggregating time series data across any combination of labels
- Multi-dimensional data model: every metric carries key-value label pairs, letting you filter and group by environment, region, service, or any dimension you define
- Built-in alerting: Alertmanager handles deduplication, grouping, silencing, and routing alerts to your notification channels
- Service discovery: native integrations with Kubernetes, Consul, EC2, and other platforms
- Local storage: an efficient on-disk time series database, purpose-built for high-ingestion workloads
For dashboards, Prometheus pairs naturally with Grafana, which can query it directly. Tools like Uptrace and OpenObserve also support Prometheus as a data source, extending what you can do with the metrics you're already collecting.
Prometheus is self-hosted, which means your metrics stay on your infrastructure. The entire project is Apache-licensed and community-governed under the CNCF.

Comprehensive monitoring and troubleshooting solution for microservices architectures, offering metrics, traces, and logs in a single pane.
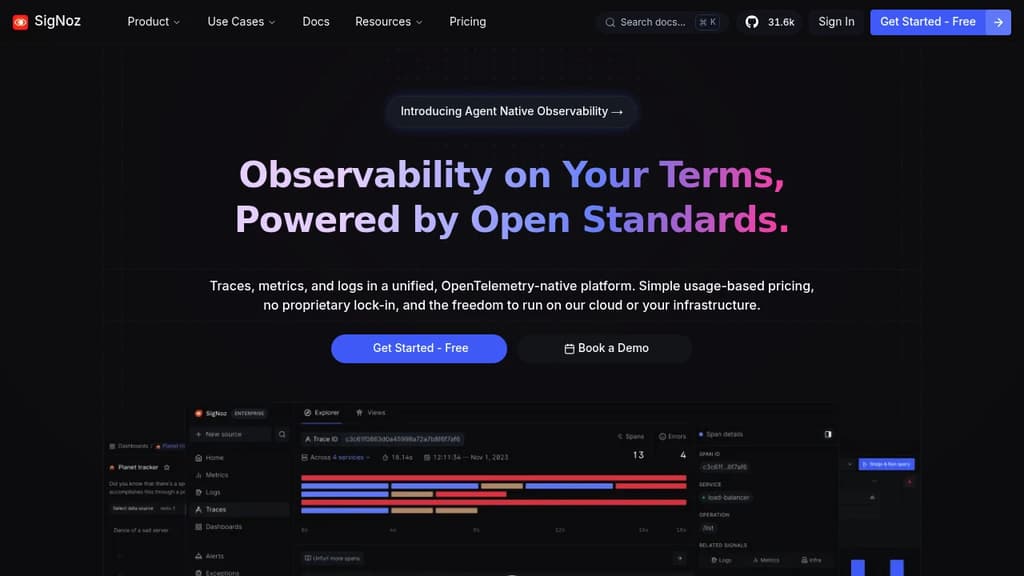
SigNoz is a powerful, open-source observability platform designed for modern, cloud-native applications. It provides a unified solution for monitoring, troubleshooting, and optimizing your microservices architecture.
Key benefits of SigNoz include:
-
All-in-One Observability: Combine metrics, traces, and logs in a single platform, eliminating the need for multiple tools and reducing context-switching.
-
Cost-Effective: As an open-source solution, SigNoz offers significant cost savings compared to proprietary alternatives, especially for high-volume data ingestion.
-
Easy Setup: Get started quickly with a simple installation process and intuitive UI, making it accessible for teams of all sizes.
-
Customizable Dashboards: Create tailored views of your system's performance with flexible, drag-and-drop dashboard builders.
-
Distributed Tracing: Gain deep insights into request flows across your microservices, helping you identify bottlenecks and optimize performance.
-
Anomaly Detection: Leverage built-in anomaly detection capabilities to proactively identify issues before they impact your users.
-
Scalability: Designed to handle high-volume data ingestion, SigNoz scales effortlessly with your growing infrastructure.
-
Open Standards: Built on OpenTelemetry, ensuring compatibility with a wide range of technologies and future-proofing your observability stack.
By choosing SigNoz, you're not just adopting a monitoring tool; you're embracing a comprehensive observability solution that grows with your needs and empowers your team to maintain high-performing, reliable applications.

PostgreSQL extension for time-series data with automatic partitioning, up to 95% columnar compression, continuous aggregates, and ~200 native SQL functions.
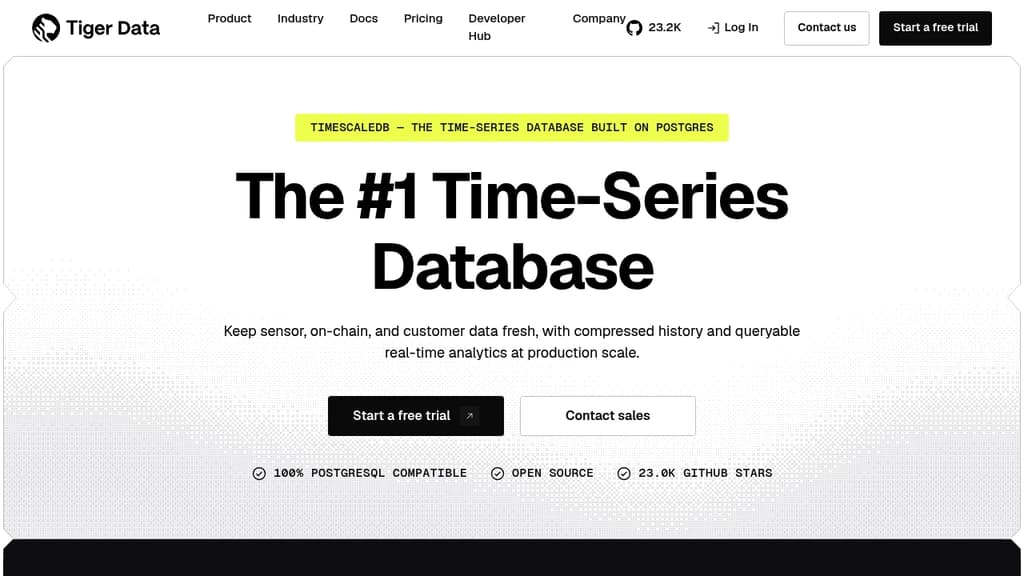
TimescaleDB is a PostgreSQL extension that turns Postgres into a purpose-built time-series database. It's designed for teams that want specialized time-series performance without abandoning the SQL ecosystem they already know. Sensor data, on-chain events, application metrics, customer behavior – if it's timestamped and high-volume, this is what it's built for.
The core abstraction is the hypertable: a regular Postgres table that's automatically partitioned by time (or ID) under the hood. Partition skipping at query planning means the database eliminates irrelevant chunks before scanning begins, so queries stay fast even as data grows into billions of rows.
Key capabilities:
- Hybrid row/columnar storage – recent data stays in the rowstore for fast ingest and point lookups; older data auto-converts to columnar format for analytical scans, with SIMD-accelerated vectorized execution
- Compression up to 95% – delta, dictionary, and RLE encodings compress historical data aggressively, and queries can filter directly on compressed data without decompressing first
- Continuous aggregates – incrementally refreshed materialized views that update in parallel batches; real-time mode includes the latest uncommitted data so dashboards never go stale
- ~200 time-series SQL functions – hyperfunctions cover time-weighted averages, interpolation, gap-filling, and partial aggregations that avoid reprocessing historical data
- Automated data management – built-in job scheduler handles retention policies, columnstore conversion, and aggregate refresh with configurable retries and full auditability
Because it's 100% PostgreSQL-compatible, existing Postgres tooling, drivers, ORMs, and extensions all work without modification. That's a meaningful difference from purpose-built alternatives like InfluxDB, QuestDB, or TDengine, which require learning new query languages or migration overhead.
Cloudflare uses it to balance analytical performance with operational simplicity, keeping analytical and configuration data under one roof. The project has 22,000+ GitHub stars and an active Slack community of 12,000+ members.

Cloud-native observability database unifying metrics, logs, and traces with sub-second queries, 50x cost reduction, and seamless OpenTelemetry integration.
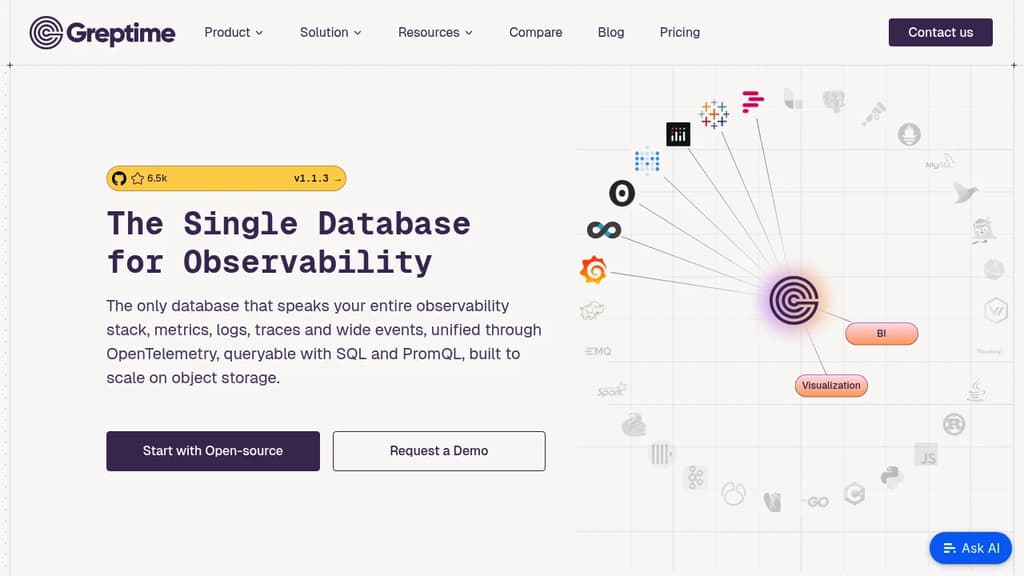
GreptimeDB is a cloud-native, real-time observability database that revolutionizes how organizations handle metrics, logs, and traces. Built for OpenTelemetry and modern cloud environments, it delivers sub-second query performance at petabyte scale while dramatically reducing operational complexity.
Key benefits include:
- All-in-One Solution: Process metrics, logs, and traces through a unified database with full SQL, PromQL, and streaming processing support
- Exceptional Performance: Built with Rust for reliability, featuring rich indexing options (inverted, fulltext, skipping, and vector) that enable sub-second responses on massive datasets
- Massive Cost Savings: Achieve 50x lower operational and storage costs through compute-storage separation and flexible cloud scaling
- Infinite Scalability: Purpose-built for Kubernetes with industry-leading architecture that handles cardinality explosion at massive scale
- Developer-Friendly: Access through standardized interfaces including web dashboard, REST API, and MySQL/PostgreSQL protocols
- Flexible Deployment: Deploy anywhere from ARM-based edge devices to cloud environments with unified APIs
Trusted by companies like Li Auto (reduced traffic costs by 50%, storage costs by 98%), SGCC (2x write performance, 5x query performance), and others who have migrated from InfluxDB, Loki, and Thanos to achieve superior performance and simplified operations.

Uptrace is an OpenTelemetry-based platform that integrates traces, metrics, and logs to help monitor and optimize complex distributed systems.
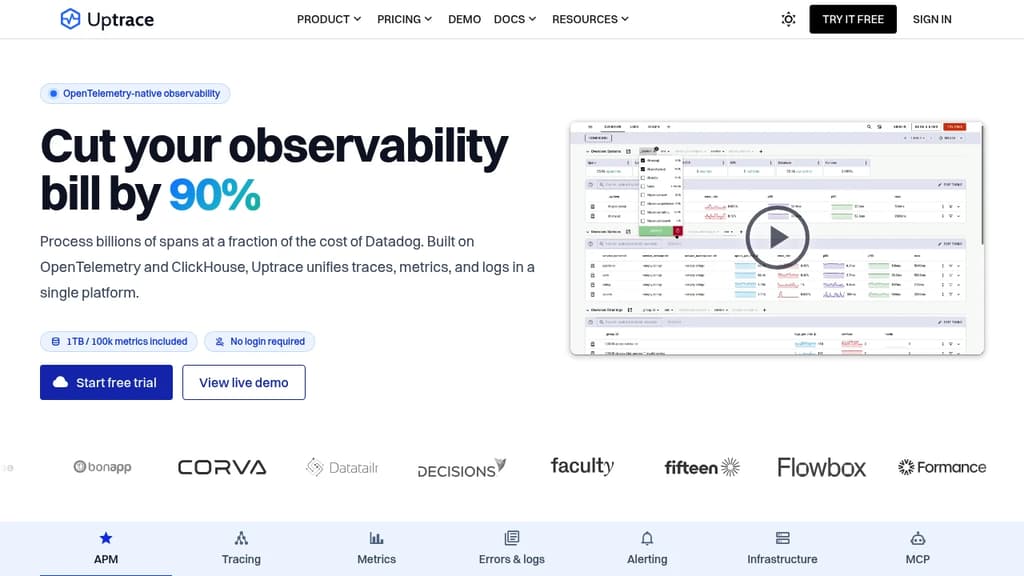
Uptrace is an open-source observability platform built on OpenTelemetry, designed to help developers and operations teams monitor, understand, and optimize complex distributed systems. It offers a comprehensive solution for application performance monitoring (APM) with integrated tracing, metrics, and logging capabilities.
Key features and benefits:
-
All-in-one solution:
- Integrates traces, metrics, and logs in a single platform
- Eliminates the need for multiple monitoring tools
- Supports data from OpenTelemetry, Prometheus, Vector, FluentBit, and CloudWatch
-
Flexible deployment options:
- Self-hosted: Free to use without limitations
- Managed cloud service: For those who prefer a hands-off approach
- On-premise installation available upon request
-
Cost-effective and predictable pricing:
- Pay only for ingested gigabytes and active timeseries
- Set a budget to avoid unexpected costs
- First month free with 1TB storage and 50,000 timeseries (no credit card required)
-
OpenTelemetry integration:
- Quick setup with minimal code changes
- Supports multiple programming languages (Go, Python, Ruby, Node.js, .NET, Java, Erlang, Elixir, Rust, PHP)
- Vendor-agnostic instrumentation for easy switching between providers
-
Comprehensive monitoring dashboard:
- Service graph showing relationships between components
- RED metrics (Rate, Errors, Duration)
- Latency percentiles (p50/p90/p99/max)
- Most frequent logs and errors
- Slowest requests identification
-
Scalability:
- Designed to work at any scale, from small applications to large distributed systems
-
Incident response:
- Helps teams identify and resolve issues quickly, often before customers notice
By offering a unified platform for observability, Uptrace simplifies the monitoring process and provides valuable insights into application performance, helping teams optimize their systems and respond to incidents more effectively.

People are looking for alternatives to...
View all alternatives
Spotify

Claude Code

Claude

CapCut
Notion

Lovable
 Postiz – The All-in-One agentic social media scheduling tool
 Stellar Hosted