Open Source GreptimeDB Alternatives
A curated collection of the 13 best open source alternatives to GreptimeDB.
The best open source alternative to GreptimeDB is Prometheus. If that doesn't suit you, we've compiled a ranked list of other open source GreptimeDB alternatives to help you find a suitable replacement. Other interesting open source alternatives to GreptimeDB are: SigNoz, Grafana Loki, Apache SkyWalking, and OpenObserve.
GreptimeDB alternatives are mainly Log Management Tools but may also be Performance Monitoring (APM) Tools or Infrastructure Monitoring Tools. Browse these if you want a narrower list of alternatives or looking for a specific functionality of GreptimeDB.

Written by Piotr Kulpinski


Pull-based monitoring system with a multi-dimensional data model, PromQL query language, built-in alerting, and a time series database built for cloud native environments.
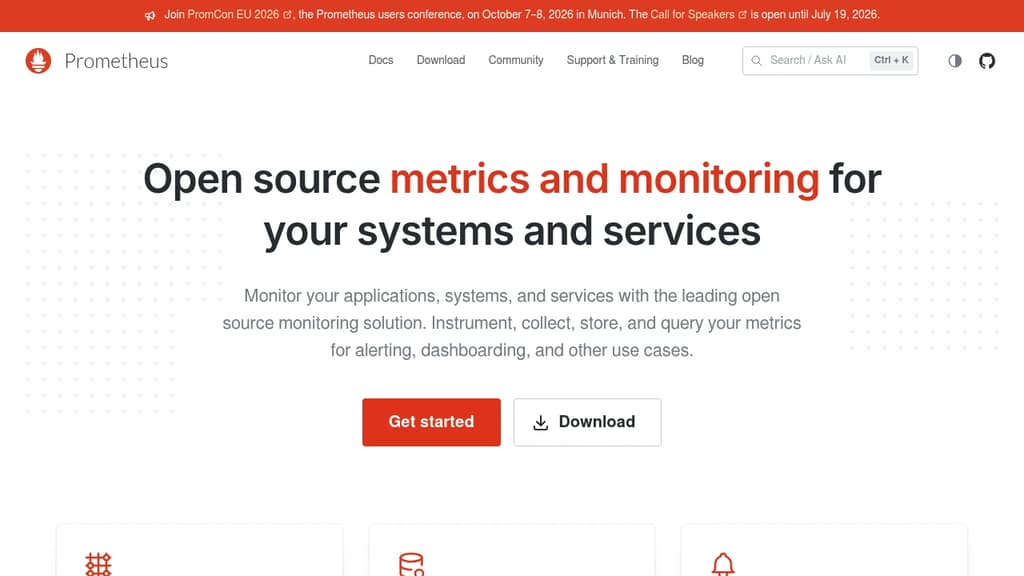
Prometheus is the de facto standard for open source infrastructure monitoring. It collects metrics from your applications, systems, and services, stores them as time series data, and lets you query, visualize, and alert on that data. Originally inspired by Google's internal Borgmon system, it's now a graduated CNCF project (the second after Kubernetes) with a large community behind it.
The core model is pull-based: Prometheus scrapes metrics from instrumented targets at configurable intervals. This makes it straightforward to see exactly what's being collected and when. Targets can be defined statically or discovered automatically, which is where its Kubernetes integration shines. It continuously discovers pods, services, and nodes as they come and go, so you don't have to manually update your monitoring config every time your infrastructure changes.
Key capabilities:
- PromQL: a flexible query language for slicing and aggregating time series data across any combination of labels
- Multi-dimensional data model: every metric carries key-value label pairs, letting you filter and group by environment, region, service, or any dimension you define
- Built-in alerting: Alertmanager handles deduplication, grouping, silencing, and routing alerts to your notification channels
- Service discovery: native integrations with Kubernetes, Consul, EC2, and other platforms
- Local storage: an efficient on-disk time series database, purpose-built for high-ingestion workloads
For dashboards, Prometheus pairs naturally with Grafana, which can query it directly. Tools like Uptrace and OpenObserve also support Prometheus as a data source, extending what you can do with the metrics you're already collecting.
Prometheus is self-hosted, which means your metrics stay on your infrastructure. The entire project is Apache-licensed and community-governed under the CNCF.

Comprehensive monitoring and troubleshooting solution for microservices architectures, offering metrics, traces, and logs in a single pane.
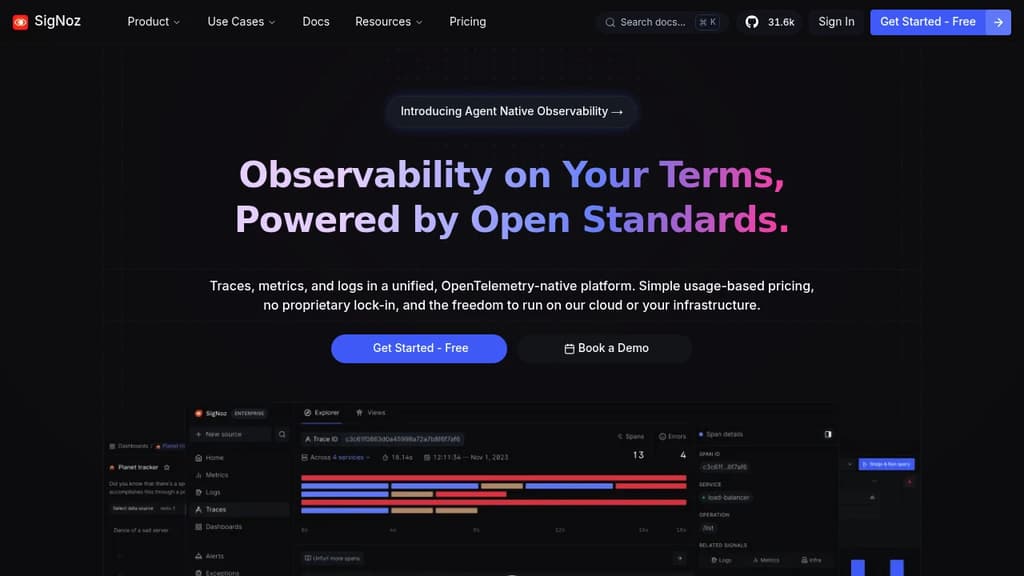
SigNoz is a powerful, open-source observability platform designed for modern, cloud-native applications. It provides a unified solution for monitoring, troubleshooting, and optimizing your microservices architecture.
Key benefits of SigNoz include:
-
All-in-One Observability: Combine metrics, traces, and logs in a single platform, eliminating the need for multiple tools and reducing context-switching.
-
Cost-Effective: As an open-source solution, SigNoz offers significant cost savings compared to proprietary alternatives, especially for high-volume data ingestion.
-
Easy Setup: Get started quickly with a simple installation process and intuitive UI, making it accessible for teams of all sizes.
-
Customizable Dashboards: Create tailored views of your system's performance with flexible, drag-and-drop dashboard builders.
-
Distributed Tracing: Gain deep insights into request flows across your microservices, helping you identify bottlenecks and optimize performance.
-
Anomaly Detection: Leverage built-in anomaly detection capabilities to proactively identify issues before they impact your users.
-
Scalability: Designed to handle high-volume data ingestion, SigNoz scales effortlessly with your growing infrastructure.
-
Open Standards: Built on OpenTelemetry, ensuring compatibility with a wide range of technologies and future-proofing your observability stack.
By choosing SigNoz, you're not just adopting a monitoring tool; you're embracing a comprehensive observability solution that grows with your needs and empowers your team to maintain high-performing, reliable applications.

Horizontally scalable, multi-tenant log aggregation system that stores and queries logs using label-based indexing instead of full-text indexing, keeping storage costs low.
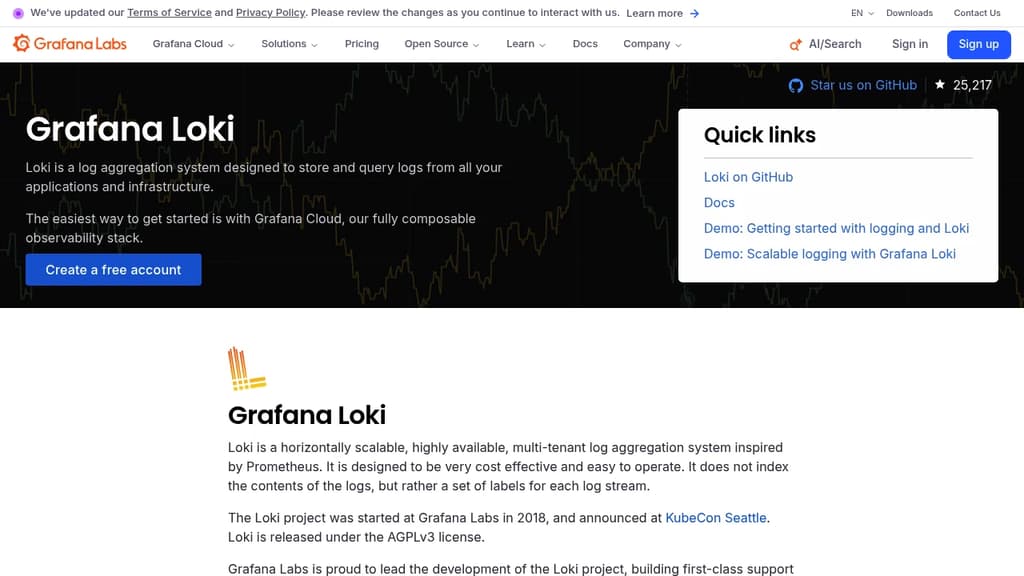
Grafana Loki is a log aggregation system built for teams that need to collect, store, and query logs at scale without paying the storage costs that come with full-text indexing. Instead of indexing every word in every log line, Loki indexes only the metadata labels attached to each log stream. That single architectural choice makes it significantly cheaper to run than alternatives, while still delivering fast queries through its own query language, LogQL.
Loki pairs naturally with Grafana for visualization and Prometheus for metrics, which means you can move between logs, metrics, and traces in a single UI without context-switching between tools. If you're already running a Prometheus-based observability stack, Loki slots in with minimal friction.
Key capabilities:
- Label-based indexing keeps storage requirements far lower than full-text index solutions, especially at petabyte scale
- Object storage backend (S3, GCS, Azure Blob, and others) for durable, cost-effective log retention
- LogQL query language lets you filter, aggregate, and build metrics directly from log lines
- Alerting integration evaluates incoming log data and routes alerts through Prometheus Alertmanager
- Promtail agent handles log collection with the same service discovery mechanism Prometheus uses, plus labeling and filtering before ingestion
- Real-time log tailing so you can watch logs as they arrive
- No ingestion format requirements means you can format and parse at query time rather than at write time
- Multi-tenancy built in, suitable for teams running shared infrastructure
Loki is horizontally scalable and designed to stay operationally simple. It's released under AGPLv3, has over 12,000 GitHub stars, and is actively maintained by Grafana Labs alongside a community of 400+ contributors. Self-hosted deployment is the open source path; Grafana Labs also offers a managed cloud version and an enterprise tier for organizations with stricter data localization requirements.

Open source observability platform covering distributed tracing, metrics, logs, profiling, and LLM cost tracking across 10+ languages with eBPF support on Kubernetes.
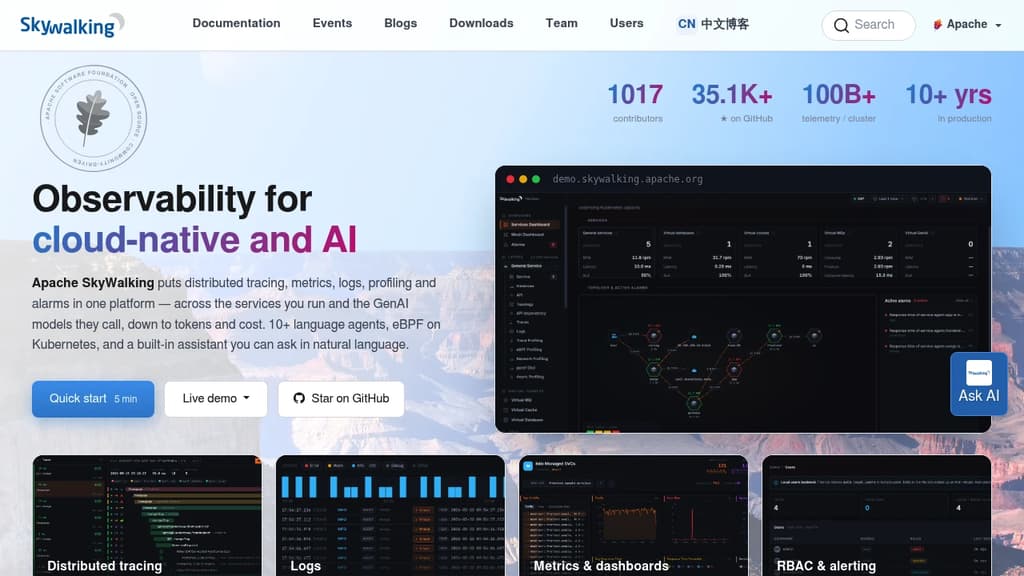
Apache SkyWalking is an observability platform built for cloud-native architectures. It pulls distributed tracing, metrics, logs, profiling, and alerting into a single UI, with auto-instrumentation agents for Java, Go, Python, Node.js, PHP, Rust, Ruby, and .NET. On Kubernetes, it goes deeper via eBPF, reaching the kernel without touching application code.
The platform handles serious scale. A single cluster can process 100 billion telemetry data points, and BanyanDB ships as a native storage backend purpose-built for that volume.
Key capabilities:
- Distributed tracing – span-by-span waterfall views, native format plus Zipkin v1/v2, with cross-service dependency analysis
- Metrics pipeline – OTLP, OpenCensus, Telegraf, Zabbix, and Prometheus all flow through one MAL script pipeline
- Log explorer – trace-correlated log browsing, metric extraction, policy-based sampling, and forwarding
- Profiling – CPU and async profiling bundled in language agents; eBPF-based profiling via Rover on Kubernetes
- GenAI monitoring – latency, traffic, token counts (input and output), and estimated cost per provider and model, making it a practical alternative to dedicated tools like OpenLIT or Arize Phoenix
- Alerting and RBAC – role-based access control with configurable alarm rules
The built-in AI assistant (called Horizon) lets you ask questions about your running system in plain language.

Monitor logs, metrics, and traces with an open-source observability platform. Achieve petabyte scale with 140x lower storage costs and high performance.
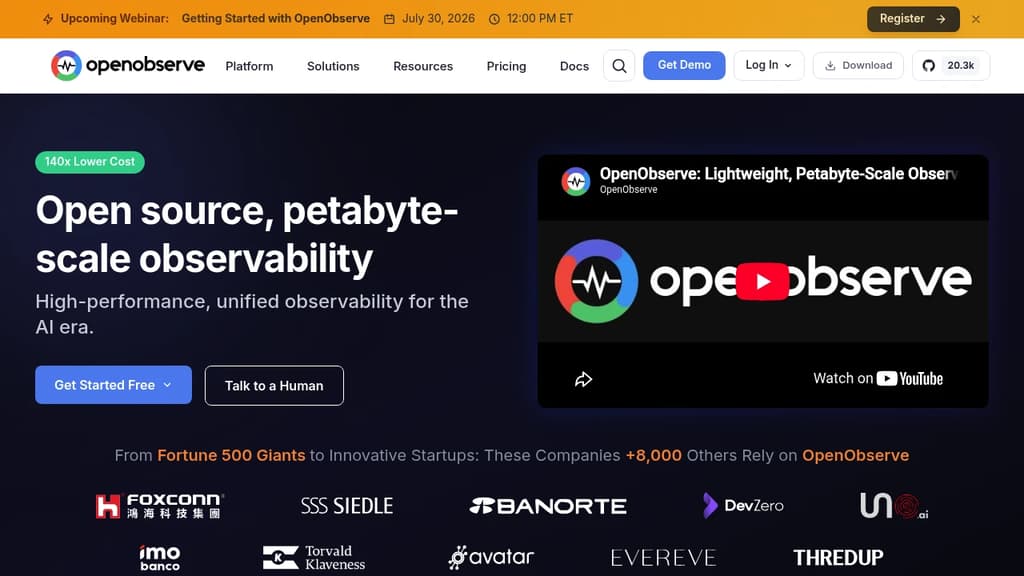
OpenObserve is a comprehensive, open-source observability platform designed for logs, metrics, and traces. It offers a modern, scalable architecture built for high performance and significant cost savings. The platform's primary advantage is its efficiency, providing up to 140x lower storage costs when compared to alternatives like Elasticsearch. This is achieved through high data compression and a columnar storage format.
Key features include:
- High Performance: Built in Rust and utilizing the DataFusion query engine for rapid data analysis, even at petabyte scale.
- Scalability: A stateless architecture allows for easy horizontal scaling to handle enterprise-level workloads.
- Cost-Effectiveness: Drastically reduces telemetry costs with high compression and the ability to use your own storage buckets like S3, GCS, and Azure Blob.
- Open Standards: Fully compatible with OpenTelemetry, ensuring seamless integration with existing tools and workflows.

Rust-built observability pipeline tool that collects, transforms, and routes logs and metrics across 47 sources and 62 sinks with no runtime dependencies.
Vector is a high-performance observability pipeline tool built in Rust. It's designed for teams that want to collect logs and metrics from many sources, transform them in flight, and send them to one or more destinations, without stitching together multiple specialized tools.
It runs as a single binary with no runtime dependencies, which means it installs cleanly on almost any infrastructure. You can deploy it as an agent on individual hosts, as a centralized aggregator, or as part of a stream-based topology. The same tool covers all three roles.
Key capabilities:
- 47 sources including Kubernetes logs, Kafka topics, Splunk HEC, Datadog Agent, and more
- 62 sinks covering destinations like Elasticsearch, AWS S3, Datadog, and many others
- 18 transforms for parsing, filtering, redacting, and reshaping data before it reaches its destination
- Programmable transforms via a built-in scripting runtime for complex logic that simple config can't handle
- Vendor-neutral by design, so you can switch backends without rewriting your pipeline
- Clear delivery guarantees documented per component, so you know exactly what trade-offs you're making
Configuration is declarative and composable. Pipelines are defined by wiring sources through transforms into sinks, and the format supports YAML, TOML, and JSON. A pipeline that redacts sensitive fields from Datadog Agent logs before forwarding them, or one that reads from Kafka and indexes into Elasticsearch, takes only a few lines.
Vector competes with tools like Logstash but prioritizes memory efficiency and throughput. It's also a natural complement to observability platforms like HyperDX or OpenObserve, feeding structured data into whatever backend you prefer. Because it's vendor-neutral, it doesn't push you toward any particular sink, and you can route the same data to multiple destinations simultaneously.
With over 13,000 GitHub stars, 300+ contributors, and 30 million downloads, it has broad real-world adoption across 40 countries.

Time series database and monitoring platform compatible with Prometheus, handling billions of metrics with lower resource usage than most alternatives.
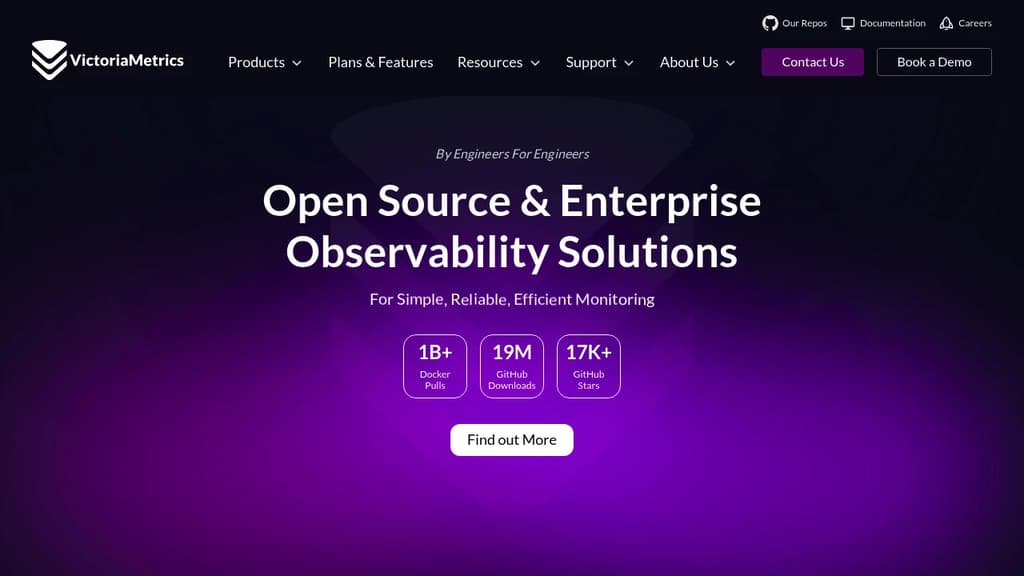
VictoriaMetrics is a time series database and observability platform built for teams that need to store and query large volumes of metrics, logs, and traces without the cost and complexity that typically comes with scale. It works as a drop-in replacement for Prometheus, so existing queries, dashboards in Grafana, and scrape configs carry over without rewriting anything.
The core appeal is efficiency. Organizations routinely report 5x to 10x reductions in storage and compute costs compared to Prometheus, Mimir, or InfluxDB at equivalent workloads. It handles millions of metrics per second on modest hardware, which makes it practical anywhere from a Raspberry Pi home lab to thousand-core distributed clusters.
Key capabilities include:
- MetricsQL: an extended query language compatible with PromQL, with additional functions for common monitoring patterns
- Long-term retention: store metrics for months or years rather than days, with optional downsampling in the enterprise tier
- High cardinality handling: stays performant where Prometheus struggles under large numbers of active time series
- OpenTelemetry support: ingest traces and logs alongside metrics through a unified stack
- Horizontal scalability: a cluster mode distributes ingestion and storage across nodes for very high throughput
- Single-binary simplicity: the single-node version runs as one process with no external dependencies
VictoriaMetrics competes directly with tools like OpenObserve, HyperDX, and GreptimeDB in the open source observability space. Its strongest differentiator is the combination of Prometheus compatibility and genuine resource efficiency at scale. Teams already running Prometheus can migrate incrementally, often within minutes, without touching their alerting rules or existing instrumentation.
An enterprise tier adds multi-tenancy, anomaly detection, downsampling, and dedicated engineering support. The open source version covers the full core feature set with no artificial limits on retention or ingestion rate.

Logstash is a free and open server-side data processing pipeline that ingests data from multiple sources, transforms it, and sends it to your desired destination.
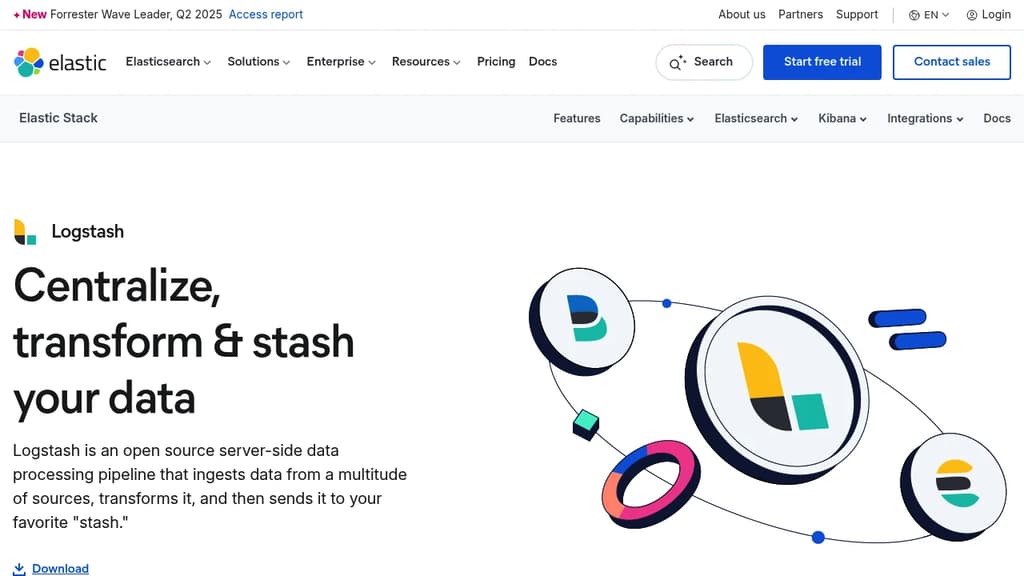
Logstash is a powerful data processing pipeline that allows you to collect, transform, and ship data from various sources to multiple destinations. Here are some key features and benefits:
-
Versatile Input Support:
- Ingest data from a wide range of sources, including logs, metrics, web applications, data stores, and AWS services.
- Supports continuous, streaming data ingestion.
-
Powerful Data Transformation:
- Parse and structure unstructured data using grok patterns.
- Derive additional information, such as geolocations from IP addresses.
- Anonymize or exclude sensitive data for compliance and security.
- Transform data into a common format for easier analysis.
-
Flexible Output Options:
- Send processed data to various destinations, with Elasticsearch being a primary output.
- Route data to multiple outputs simultaneously for different use cases.
-
Extensibility:
- Pluggable framework with over 200 plugins available.
- Easy-to-build custom plugins for specific needs.
-
Reliability and Security:
- Guarantees at-least-once delivery with persistent queues.
- Dead letter queues for handling processing failures.
- Ability to secure ingest pipelines.
-
Monitoring and Management:
- Built-in monitoring features for observing performance and availability.
- Pipeline Viewer for understanding and optimizing data flows.
- Centralized management through a user-friendly UI.
-
Elastic Stack Integration:
- Seamless integration with other Elastic Stack components like Elasticsearch and Kibana.
- Pre-built modules for quick setup with popular data sources.
Logstash is an essential tool for organizations looking to centralize and process their data efficiently, making it ready for analysis and visualization in platforms like Elasticsearch and Kibana.

Open source observability platform unifying session replays, logs, traces, metrics and errors. Fast search, automatic clustering, $0.40/GB pricing.
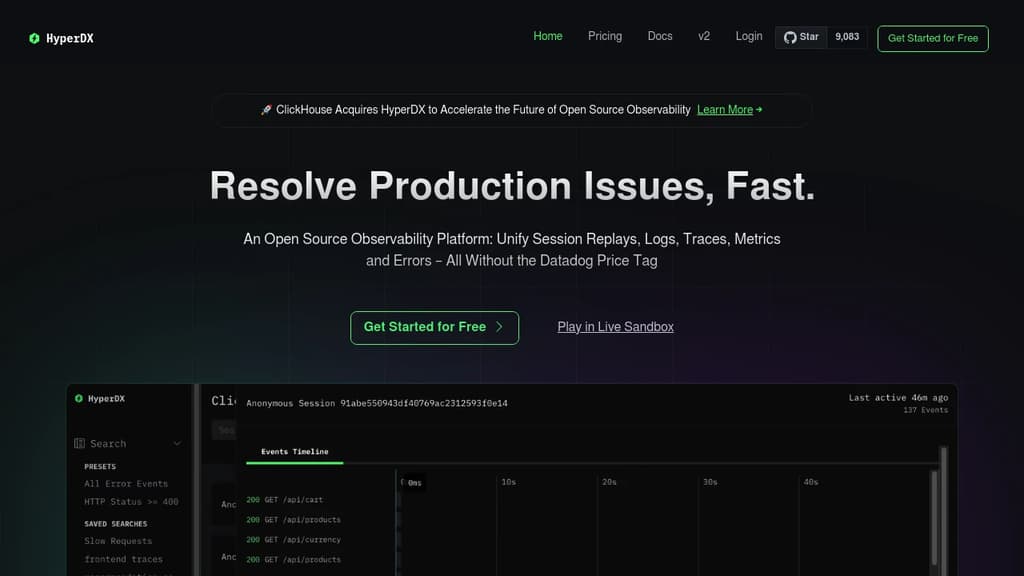
Open source observability platform that unifies session replays, logs, traces, metrics and errors into a single view - all without the expensive Datadog price tag. Recently acquired by ClickHouse to accelerate open source observability innovation.
Key capabilities include:
- End-to-end correlation - Trace requests from user browsers to backend servers and async workers automatically
- Blazing fast search - Query terabytes of events in seconds, powered by ClickHouse
- Automatic clustering - Condense billions of events into distinctive patterns without manual configuration
- Session replay integration - Automatically link user sessions with backend logs and traces
- Intuitive visualization - Build charts and graphs with simple full-text search, no complex syntax required
Developer-friendly features:
- OpenTelemetry-powered instrumentation prevents vendor lock-in
- Agent-free installation option eliminates infrastructure overhead
- Native JSON parsing for structured logs with zero configuration
- Real-time live tail for immediate log stream monitoring
- Intercom integration for jumping directly from support tickets to user sessions
Transparent pricing at $0.40 per GB with no per-user or per-host fees makes enterprise-grade observability accessible to teams of all sizes. Trusted by high-velocity engineering teams for resolving production issues fast.

Coroot simplifies system monitoring by providing metrics, logs, traces, and profiling with zero instrumentation, leveraging eBPF technology.
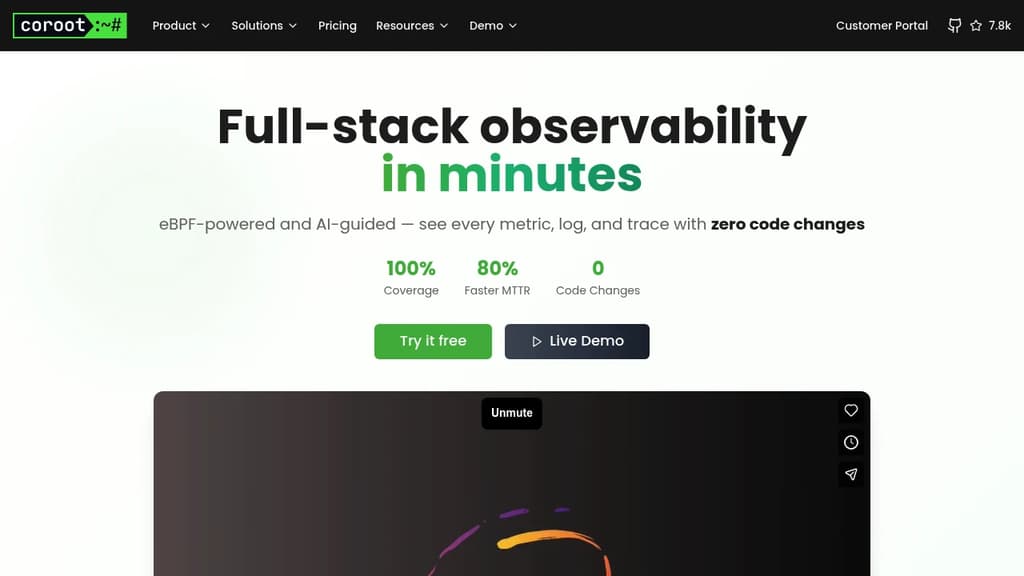
Coroot is an innovative open-source observability platform that revolutionizes how developers and operations teams monitor and troubleshoot their systems. Here's what makes Coroot stand out:
-
Zero-instrumentation observability:
- Utilizes eBPF technology to automatically gather metrics, logs, traces, and profiles without any code changes
- Provides a comprehensive Service Map covering 100% of your system with no blind spots
- Offers predefined inspections to audit each application without configuration
-
Comprehensive monitoring features:
- Application Health Summary for easy status overview of multiple services
- Distributed tracing to explore outlier requests with a single click
- Log pattern analysis with out-of-the-box event clustering
- Continuous profiling to analyze CPU and memory usage down to specific code lines
- AI-powered root cause analysis for quick anomaly explanations
-
User-friendly interface:
- Intuitive dashboards for visualizing system performance
- One-click investigation of anomalies
- Easy comparison of system behavior against baselines
-
Built-in expertise:
- Automatically identifies over 80% of issues
- Sends concise alerts with relevant inspection results when SLOs are not met
- Customizable inspections for specific applications or entire projects
-
Deployment and cost monitoring:
- Tracks every application rollout in Kubernetes clusters
- Compares each release with the previous one to detect performance degradations
- Provides cloud cost insights down to individual applications
-
Open-source and cloud options:
- Available as a free, open-source Community Edition
- Coroot Cloud offering for those who prefer a managed solution
Coroot simplifies the complex task of system observability, making it accessible to teams of all sizes. By leveraging cutting-edge technologies and providing a user-friendly interface, Coroot enables faster debugging, better development practices, and improved system reliability.

Logfire offers intuitive observability tools for Python applications, combining logs, profiling, and telemetry in one platform.
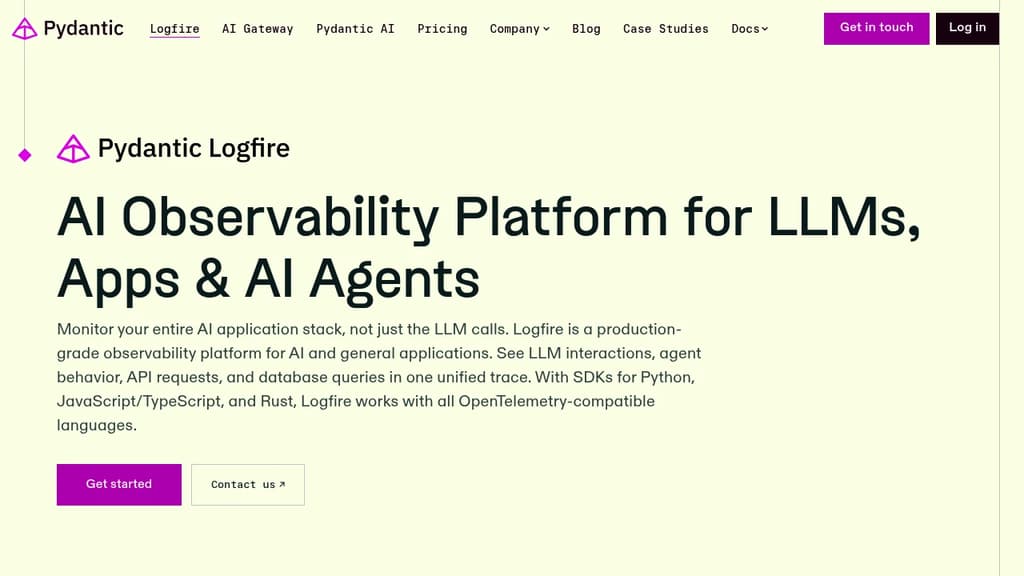
Logfire brings powerful observability to Python applications with remarkable simplicity. Built by the team behind Pydantic, it offers developers an intuitive way to gain deep insights into their code.
Key features:
- Seamless integration: Easy setup with popular Python libraries and frameworks
- Comprehensive visibility: Monitor logs, traces, and performance metrics in one place
- Structured data: Query-ready logs for easy analysis and visualization
- Manual tracing: Create custom logs and traces with a modern, user-friendly interface
- OpenTelemetry support: Leverage the power of OTel with simplified implementation
Logfire transforms complex observability tasks into actionable insights. Whether you're building AI tools or cloud-based applications, it provides a clear window into your code's behavior. With features like performance profiling and full execution tracing, Logfire helps developers quickly identify and resolve issues.
The platform's intuitive design makes it accessible for teams of all sizes, eliminating the need for dedicated observability experts. By combining ease of use with powerful analytics capabilities, Logfire empowers developers to make data-driven decisions and continuously improve their applications.

Observability platform built on OpenTelemetry and ClickHouse. Collect, visualize, and query distributed traces, logs, and metrics, with an MCP server for AI agent diagnostics.
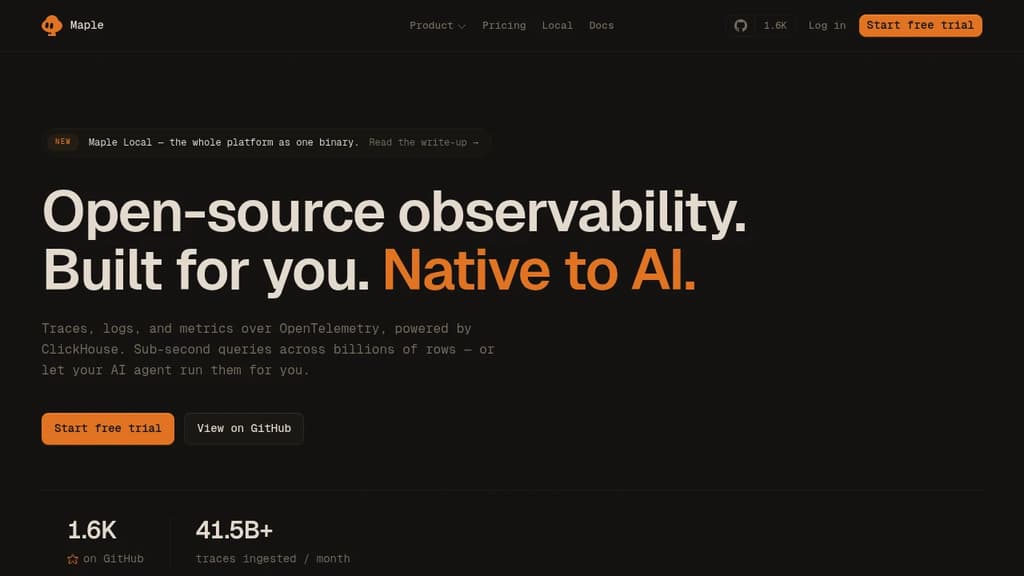
Maple is an observability platform for distributed systems, built on OpenTelemetry and backed by ClickHouse for sub-second queries across billions of rows. It handles traces, logs, and metrics in one place, with correlated data across all three signals tied to a single trace ID. No stitching between tools, no second search in a second product.
The incident workflow is its sharpest edge. An alert arrives carrying the service, the broken threshold, and sample traces. From there you open the failing span tree, jump to correlated logs on the same trace ID, and see exactly what happened. Retry exhaustion, a full connection pool, three Stripe timeouts at 1.75 seconds each – all visible without switching tabs.
Key capabilities:
- Distributed tracing – full span trees with every attribute intact, no sampling gap hiding the outlier
- Structured logs – OTLP logs searchable by severity, service, message, and duration in seconds
- Session replay – browser clicks, routes, console lines, and failed requests, joined to spans by session ID
- Metrics and dashboards – request rate, error rate, latency percentiles, drag-to-build or agent-suggested
- Service maps – live request flow across services, the dependency cascade you'd otherwise reconstruct after the fact
- Error tracking – errors grouped by type, with trends, affected services, and sample traces attached
- Alerting – seven signal types with severity, incident tracking, and auto-resolution; routes to Slack, Discord, PagerDuty, or any webhook
- MCP server – any compatible AI agent (Claude, Cursor, others) can list services, search traces, read source files, and open a PR with a proposed fix
- Kubernetes integration – Helm chart that joins spans to pod, node, and namespace; kube-state metrics included
Compared to tools like HyperDX or Uptrace, Maple's first-class MCP surface is a genuine differentiator. The agent doesn't just read dashboards – it pulls the source file behind a failing span, so the fix it proposes cites your actual code. It can also write back: claim an issue, set severity, attach a fix.
The local mode runs as a single compiled binary with an embedded ClickHouse, OTLP ingest, query API, and dashboard – all on localhost, no account required. For production, you can self-host against your own ClickHouse or use the hosted plan at $39/month for 100 GB per signal, then $0.30/GB flat. No per-host fees. No per-seat fees.
The source is on GitHub under FSL-1.1, which converts to Apache 2.0 two years after each release. OpenTelemetry in means no proprietary agent and no re-instrumentation if you switch.

Unified platform for logs, metrics, traces and profiles with native compatibility for popular tools like OpenTelemetry, Prometheus, and Loki. No data silos, no usage limits.
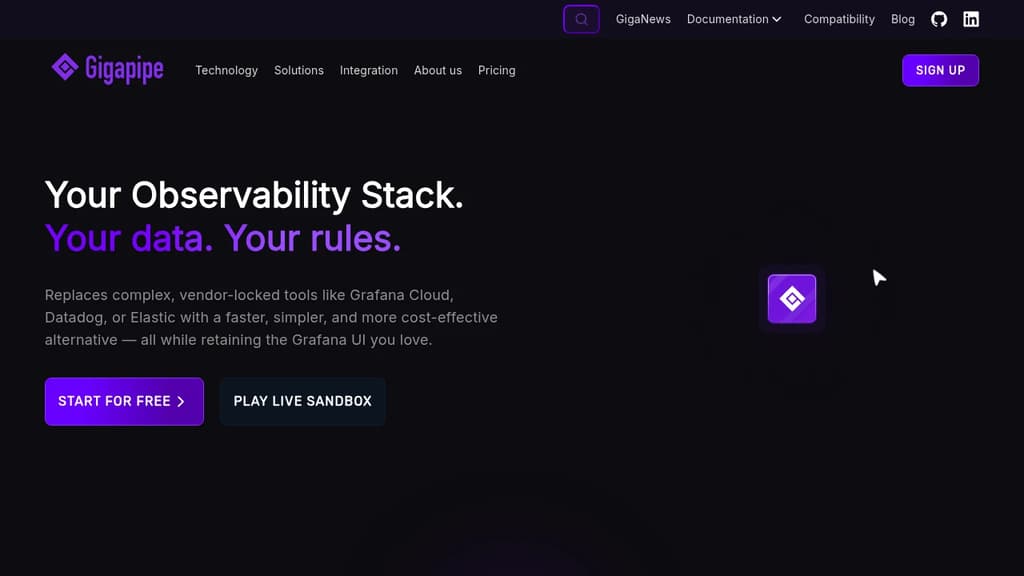
A powerful observability platform that brings together logs, metrics, traces and profiles in one unified solution. Built on high-performance OLAP engines ClickHouse and DuckDB with NVMe storage, Gigapipe delivers exceptional speed and reliability.
Key advantages:
- Drop-in compatibility with OpenTelemetry, Loki, Prometheus, Tempo, Pyroscope and other popular tools
- Flat-cost pricing model with no usage limits or surprise bills
- True open source solution under AGPLv3 license
- Single platform approach eliminates data silos and reduces complexity
- Native support for thousands of compatible agents
- Query API that emulates familiar tools like Loki and Prometheus
Perfect for engineering teams and DevOps professionals who need comprehensive observability without the complexity of managing multiple tools or worrying about data volume costs. Gigapipe's polyglot approach ensures you can work with your data your way, while the unified platform enables quick correlation between different data types for faster troubleshooting and deeper insights.

People are looking for alternatives to...
View all alternatives
Claude Code

Spotify

CapCut

Claude
Notion

Lovable
 Openlane – Open-source, developer-first platform for automated compliance, risk management, and built-in Trust Center.


 c15t
c15t