Open Source Site24x7 Alternatives
A curated collection of the 11 best open source alternatives to Site24x7.
The best open source alternative to Site24x7 is Uptime Kuma. If that doesn't suit you, we've compiled a ranked list of other open source Site24x7 alternatives to help you find a suitable replacement. Other interesting open source alternatives to Site24x7 are: NetData, SigNoz, Checkmate, and Gatus.
Site24x7 alternatives are mainly Infrastructure Monitoring Tools but may also be Uptime Monitoring Tools or Status Pages. Browse these if you want a narrower list of alternatives or looking for a specific functionality of Site24x7.

Written by Piotr Kulpinski

Monitors websites, APIs, and services with real-time alerts, a status page, and support for dozens of notification channels. Self-hosted and Docker-friendly.
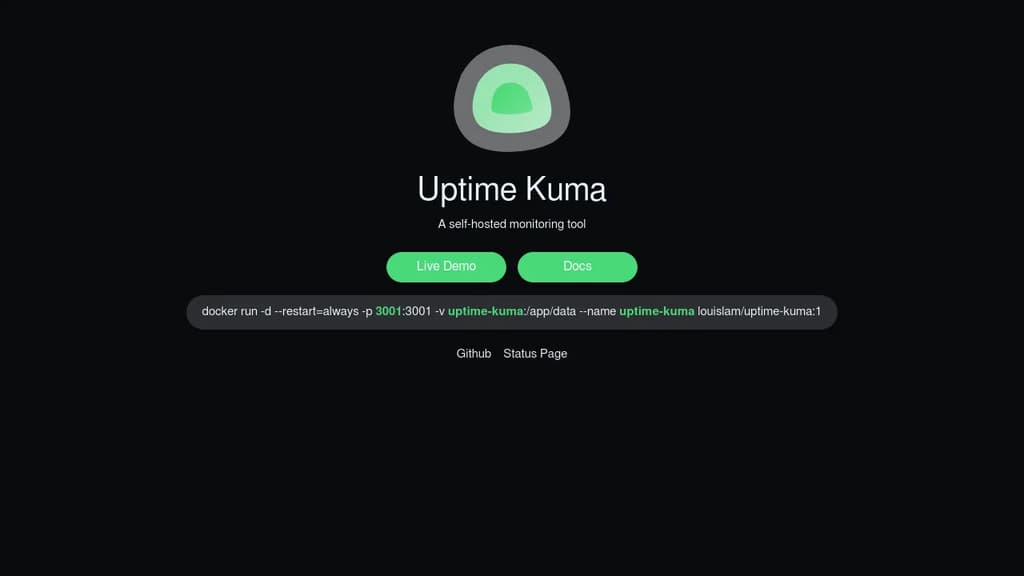
Uptime Kuma is a self-hosted uptime monitoring tool built for teams and individuals who want full control over their monitoring data without relying on a third-party SaaS. It's a popular UptimeRobot alternative you can run on your own infrastructure.
The interface is clean and reactive, showing live status for all your monitors without needing a page refresh. You can track HTTP(S) endpoints, TCP ports, DNS records, Docker containers, databases, and more. Each monitor gets its own response time graph and uptime history.
Key capabilities include:
- 90+ notification integrations covering Slack, Telegram, Discord, PagerDuty, email, webhooks, and many others
- Status pages you can publish publicly or keep private, with custom domains and branding
- Multiple monitor types including keyword matching, JSON query checks, gRPC, and certificate expiry monitoring
- Maintenance windows to pause alerts during planned downtime
- Two-factor authentication and multi-user support for team access
- Ping and heartbeat monitors for cron jobs and background tasks
Compared to tools like Checkmate or OpenStatus, Uptime Kuma is deliberately lightweight. It runs as a single Docker container with no external database required, storing everything in SQLite. That makes it easy to self-host on a small VPS or home server without much overhead.
It doesn't offer distributed probing from multiple global locations out of the box, which tools like Peekaping do. But for a single-node monitor covering your own services, it covers the essentials well and has a large, active community behind it.

Powerful, efficient, and user-friendly monitoring solution for servers, containers, and applications with instant insights and alerts.
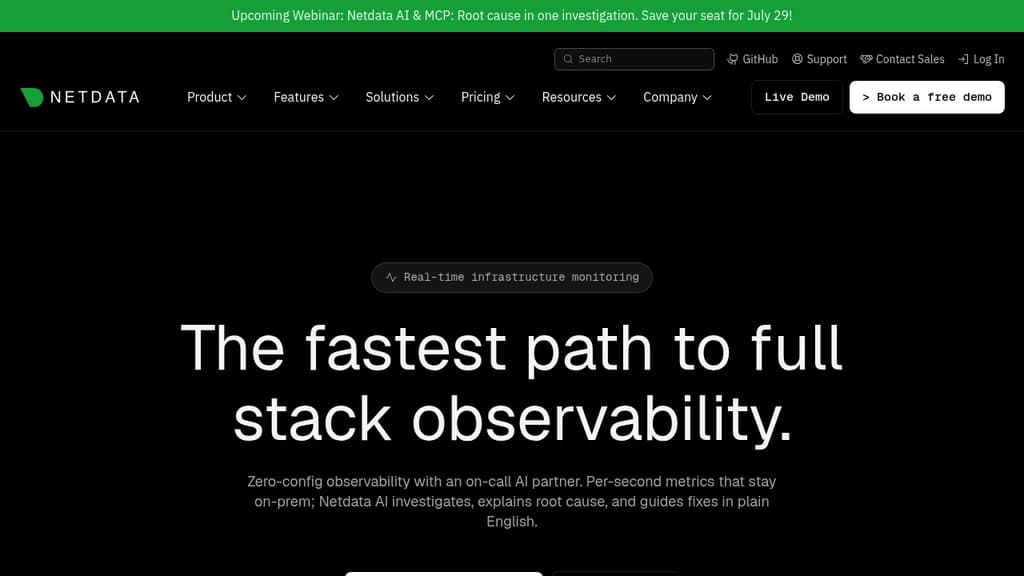
NetData is a cutting-edge, open-source monitoring and troubleshooting tool designed for modern infrastructure and applications. It offers real-time, high-resolution metrics collection and visualization, enabling users to gain instant insights into their systems' performance.
Key benefits of NetData include:
- Lightning-fast performance: Collects thousands of metrics per second with minimal resource usage.
- Zero configuration: Auto-detects and monitors services out of the box, reducing setup time.
- Stunning visualizations: Provides interactive, customizable dashboards for easy data interpretation.
- Scalability: Efficiently monitors everything from single servers to large-scale distributed systems.
- Alerting: Offers intelligent, customizable alerts to detect and respond to issues promptly.
- Extensibility: Supports plugins and integrations with popular monitoring stacks.
NetData empowers DevOps teams, system administrators, and developers to identify and resolve performance bottlenecks quickly. Its user-friendly interface and powerful analytics capabilities make it an essential tool for maintaining optimal system health and performance in today's fast-paced, data-driven environments.

Comprehensive monitoring and troubleshooting solution for microservices architectures, offering metrics, traces, and logs in a single pane.
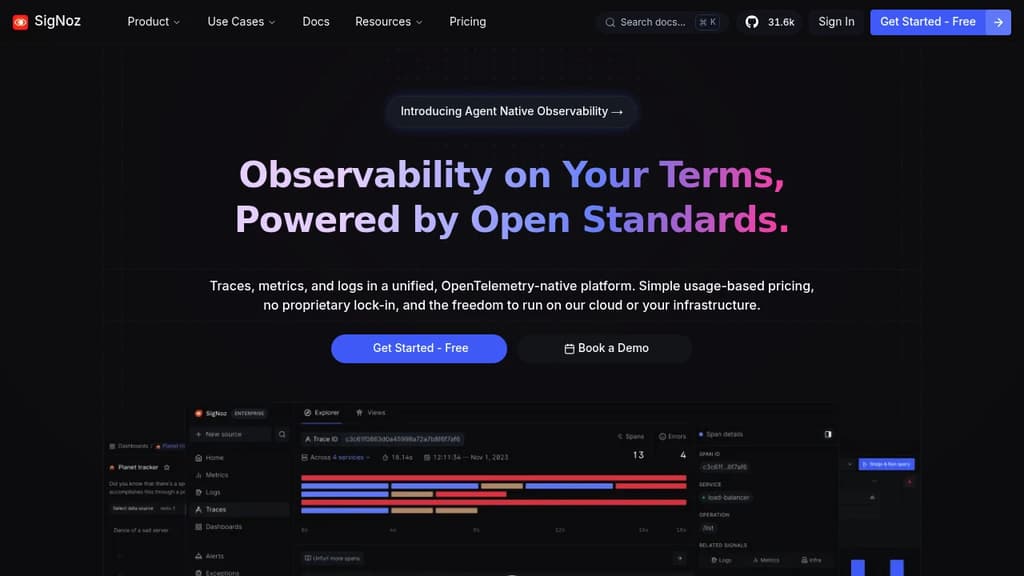
SigNoz is a powerful, open-source observability platform designed for modern, cloud-native applications. It provides a unified solution for monitoring, troubleshooting, and optimizing your microservices architecture.
Key benefits of SigNoz include:
-
All-in-One Observability: Combine metrics, traces, and logs in a single platform, eliminating the need for multiple tools and reducing context-switching.
-
Cost-Effective: As an open-source solution, SigNoz offers significant cost savings compared to proprietary alternatives, especially for high-volume data ingestion.
-
Easy Setup: Get started quickly with a simple installation process and intuitive UI, making it accessible for teams of all sizes.
-
Customizable Dashboards: Create tailored views of your system's performance with flexible, drag-and-drop dashboard builders.
-
Distributed Tracing: Gain deep insights into request flows across your microservices, helping you identify bottlenecks and optimize performance.
-
Anomaly Detection: Leverage built-in anomaly detection capabilities to proactively identify issues before they impact your users.
-
Scalability: Designed to handle high-volume data ingestion, SigNoz scales effortlessly with your growing infrastructure.
-
Open Standards: Built on OpenTelemetry, ensuring compatibility with a wide range of technologies and future-proofing your observability stack.
By choosing SigNoz, you're not just adopting a monitoring tool; you're embracing a comprehensive observability solution that grows with your needs and empowers your team to maintain high-performing, reliable applications.

Monitor servers, websites, Docker containers, and infrastructure with real-time insights, instant alerts, and powerful analytics. Self-hosted solution.
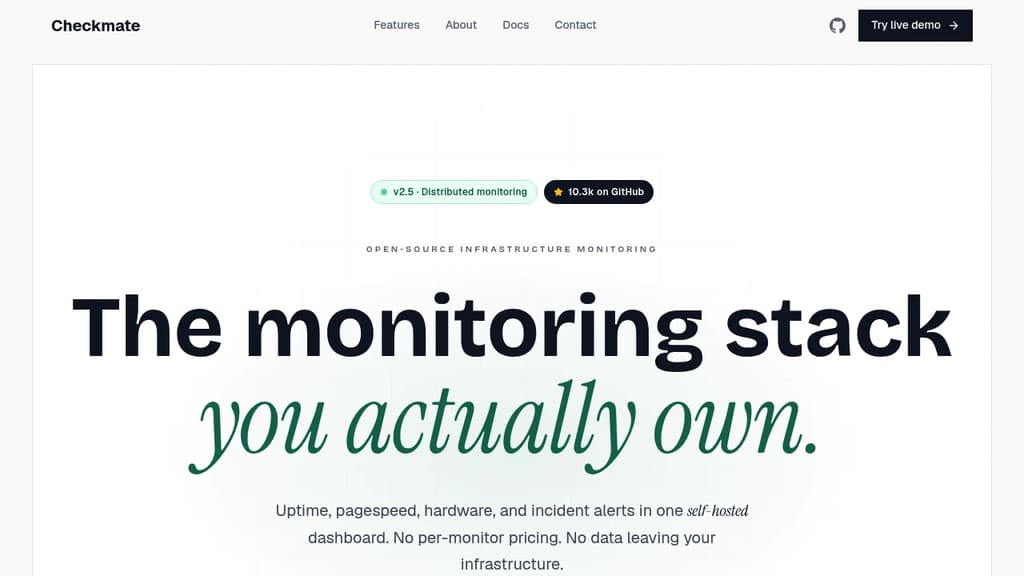
Comprehensive monitoring made simple - Get real-time insights into your entire infrastructure with powerful analytics and instant alerts. Track everything from website uptime to Docker container health in one unified platform.
Key monitoring capabilities:
- Website monitoring - Track uptime, performance, and availability across multiple locations
- Infrastructure monitoring - Monitor CPU, memory, disk usage, and system performance
- Docker monitoring - Real-time container health and resource usage tracking
- Page speed insights - Detailed performance metrics and optimization recommendations
- Network monitoring - Ping checks for latency and availability monitoring
Built for modern teams with incident management, email notifications, maintenance windows, and self-hosted deployment options. Say goodbye to complex enterprise platforms - Checkmate delivers powerful monitoring with simplicity at its core.
Flexible deployment options - Start with the free open-source version (AGPL-3.0 licensed) or scale with enterprise features including dedicated support, custom branding, and high availability deployments. Feature sponsorship available at $190/day to accelerate development of specific capabilities.

A highly customizable monitoring solution that provides automated status pages, extensive alerting options, and detailed testing capabilities for your services and infrastructure
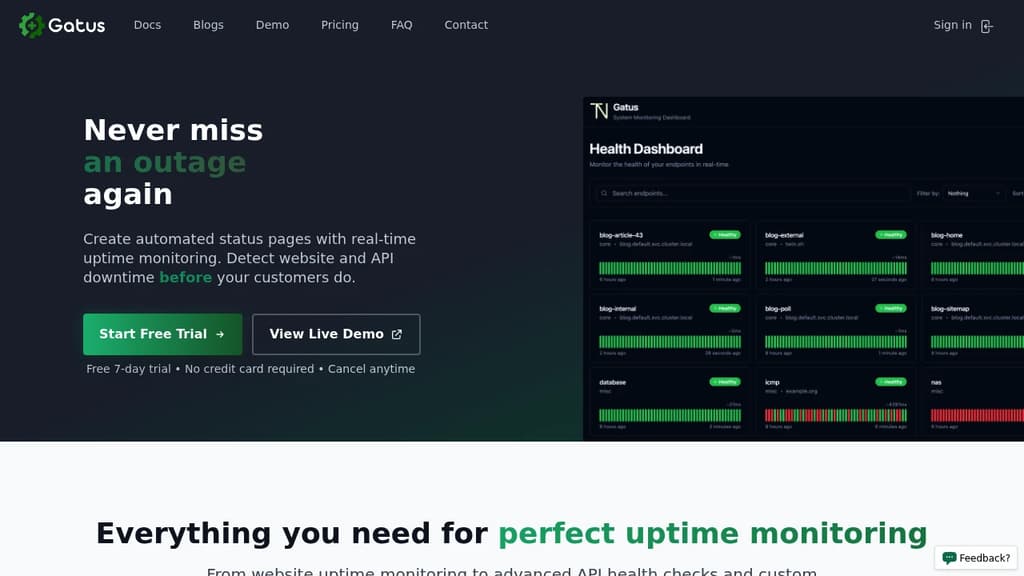
Gatus is a powerful monitoring solution that helps you keep track of your infrastructure's health in real-time. The platform offers comprehensive monitoring capabilities for HTTP, GraphQL, DNS, ICMP/PING, TCP, and certificate expiration checks.
Key features include:
- Highly customizable monitoring with conditions for response time, body content, and IP addresses
- Extensive alerting system supporting Email, Slack, PagerDuty, Teams, Twilio, Discord, and more
- Developer-focused approach with detailed insights and automated user acceptance testing
- Real-time status updates that automatically reflect your services' current state
- Customer-centric design providing clear, accurate information about ongoing issues
The platform stands out by being completely open source, allowing for community contributions and custom feature development. Unlike traditional status pages that only show historical uptime, Gatus focuses on providing immediate, actionable information about current service status.

All-in-one solution for uptime monitoring, incident management, and status pages to keep your services running smoothly
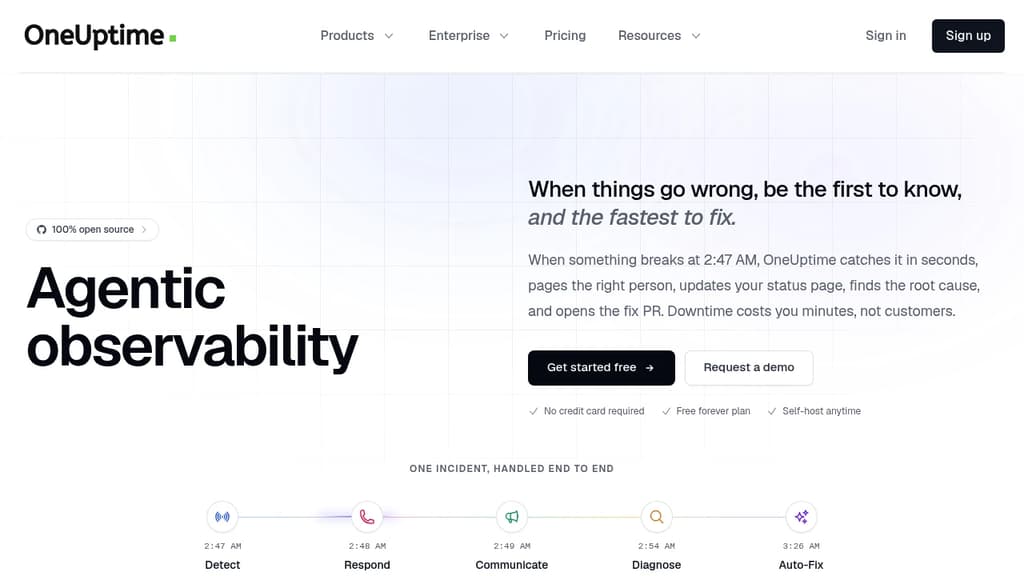
OneUptime is a powerful, open-source platform designed to help businesses maintain optimal service reliability and performance. By combining essential features into a single, intuitive solution, OneUptime streamlines your operations and enhances your ability to respond to issues quickly and effectively.
Key benefits of OneUptime include:
- Unified Monitoring: Keep track of your entire infrastructure with comprehensive uptime monitoring for websites, APIs, and servers.
- Proactive Alerts: Receive instant notifications through various channels when issues arise, allowing for rapid response and minimized downtime.
- Incident Management: Efficiently handle and resolve incidents with built-in tools for team collaboration, task assignment, and progress tracking.
- Custom Status Pages: Create branded, real-time status pages to keep your customers informed about service availability and ongoing incidents.
- Performance Insights: Gain valuable insights into your system's performance with detailed metrics and analytics.
- Flexible Integrations: Seamlessly integrate with popular tools and services to enhance your existing workflow.
- Open-Source Advantage: Benefit from community-driven development, transparency, and the ability to customize the platform to your specific needs.
With OneUptime, you can ensure your services remain reliable, your team stays informed, and your customers experience minimal disruption. Whether you're a small startup or a large enterprise, OneUptime provides the tools you need to maintain high availability and build trust with your users.

Monitors networks, servers, cloud services, IoT, and OT environments with no per-device licensing fees, available self-hosted or as a managed SaaS platform.

Zabbix is a full-scale observability platform built for enterprises that need to monitor everything from physical servers and network devices to cloud workloads, IoT sensors, and operational technology. It's been deployed in over 300,000 environments across 190+ countries, and its fixed-cost support model (no per-device charges, no license fees) makes it a practical choice for large-scale operations where commercial tools get expensive fast.
The platform covers IT and OT in a single interface, giving teams one place to track infrastructure health across data centers, cloud providers, and edge locations. You can deploy it on your own infrastructure for full data ownership, run it on public clouds like AWS, Azure, or Google Cloud, or use Zabbix Cloud as a fully managed SaaS option. All three paths give you the same monitoring capabilities.
Key capabilities include:
- Automated discovery that finds and begins monitoring new devices without manual configuration
- Webhook integrations for connecting to external systems like ticketing or incident management tools
- Multitenant support designed for managed service providers running monitoring across multiple clients
- Log monitoring alongside metrics, so infrastructure and application data live in one platform
- Real-time alerting with configurable thresholds and escalation paths
Compared to tools like Nagios or Icinga, Zabbix ships with a more polished web interface and broader built-in integrations out of the box. Teams that want richer visualization can connect it to Grafana for dashboards. For those evaluating cloud-native observability stacks, SigNoz and OpenObserve are worth comparing, though they focus more on traces and logs than on the broad infrastructure monitoring Zabbix covers.
With 24/7 support averaging a 12-minute response time and a global partner network of 290+ certified providers, Zabbix is built for organizations that treat monitoring as critical infrastructure, not an afterthought.
Monitor your entire IT infrastructure with 2,000+ plugins, automated discovery, and scalable architecture. Open source and enterprise solutions available.
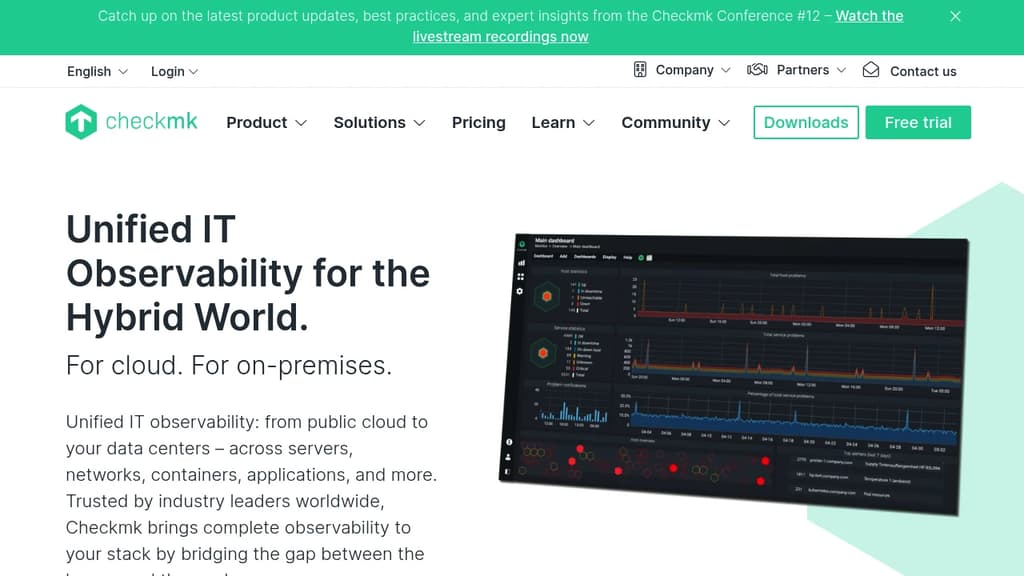
Comprehensive IT monitoring that scales from small teams to enterprise environments with millions of services. Checkmk automatically discovers and monitors your entire infrastructure - from cloud providers to data centers, servers, networks, containers, and applications.
Key advantages include:
- 2,000+ vendor-maintained plugins for out-of-the-box monitoring of virtually any system
- Automated discovery and configuration via REST API reduces manual setup time
- High-performance core designed to handle massive scale while maintaining a small footprint
- Granular alerting system that notifies only relevant teams and integrates with ServiceNow, Jira, Slack, and more
Multiple deployment options cater to different needs:
- Raw Edition: Free open-source version for mid-sized infrastructures
- Enterprise Edition: Advanced automation and visualization features
- Cloud Edition: SaaS solution optimized for hybrid cloud environments
- MSP Edition: Multi-tenant capabilities for service providers
Advanced features include dynamic dashboards, business intelligence mapping, custom self-healing actions, and comprehensive SLA reporting. The platform combines infrastructure monitoring with log analysis, synthetic testing capabilities, and historical performance forecasting to provide complete visibility into your IT operations.

Monitor networks, servers, and cloud environments with flexible open-source solution. Custom checks, fast alerts, and complete infrastructure control.
Complete visibility across your entire IT landscape with this comprehensive open-source monitoring platform. Whether managing on-premises servers, cloud environments, or hybrid infrastructures, you get the flexibility and control needed for complex enterprise monitoring.
Key capabilities include:
- Real-time monitoring of servers, networks, applications, and services
- Custom check configurations tailored to your specific requirements
- Fast alerting system to detect and respond to issues before they escalate
- Scalable architecture that grows with your infrastructure needs
- Multi-tenancy support for enterprise environments
- High availability configurations for mission-critical monitoring
Comprehensive monitoring solutions cover Kubernetes clusters, database performance, Windows and VMware environments, plus business-critical applications. The platform bridges monitoring with IT service workflows and security operations for unified visibility.
Enterprise-ready features include automation capabilities, API-driven processes, extensive integrations with existing DevOps tools, and professional support options. Built on open-source principles while delivering enterprise-grade stability, security, and customization options that adapt to your operational needs.

Free open source IT monitoring solution for servers, networks, and applications. Trusted by 1M+ users worldwide with powerful alerting and enterprise-grade features.
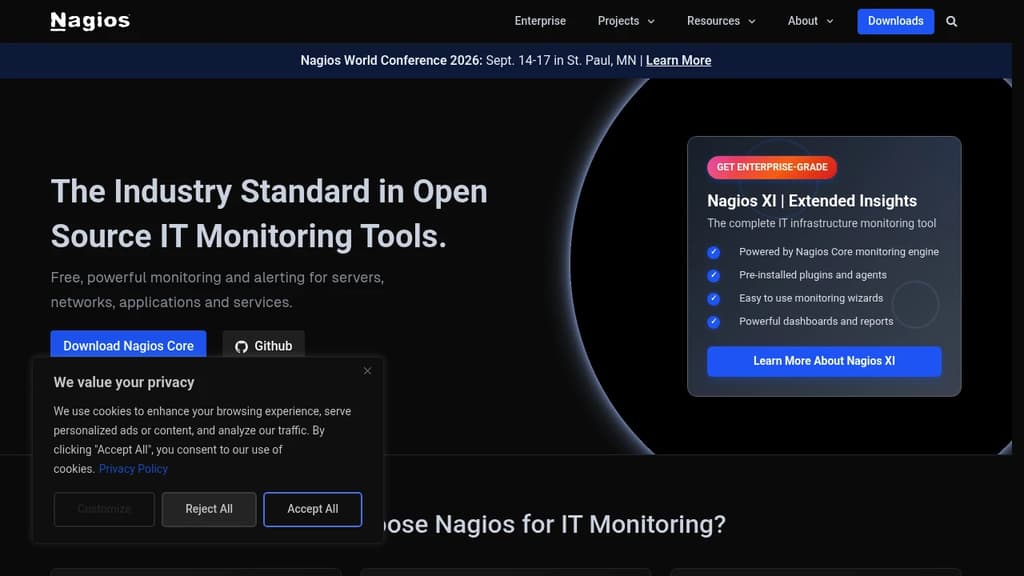
Nagios is the industry-standard open source monitoring solution that has been protecting critical IT infrastructure for over 25 years. Trusted by more than 1 million users worldwide, this powerful platform provides comprehensive monitoring and alerting for servers, networks, applications, and services.
The platform offers complete infrastructure monitoring capabilities, supporting Windows, Linux systems, and network devices to prevent downtime before it impacts business operations. With its powerful plugin architecture, users can extend functionality through thousands of community-developed plugins, including NRPE, NSCA, and custom monitoring solutions.
Key benefits include:
- Free, enterprise-grade monitoring with intuitive wizards and dashboards
- 573+ community add-ons available through Nagios Exchange
- Pre-configured solutions including Nagios XI for extended insights
- Global community support with active development and contributions
- Proven reliability with 4+ years in production environments
The Nagios Core Services Platform provides everything needed in one comprehensive package, including the monitoring engine, 50+ official plugins, cross-platform agents, and configuration tools. Whether you're monitoring simple setups or complex enterprise infrastructure, Nagios delivers the flexibility and reliability needed to maintain optimal system performance.

Hosted uptime monitoring with multi-region checks, eight monitor types, on-call rotations, escalation policies, and public status pages for SaaS teams and agencies.
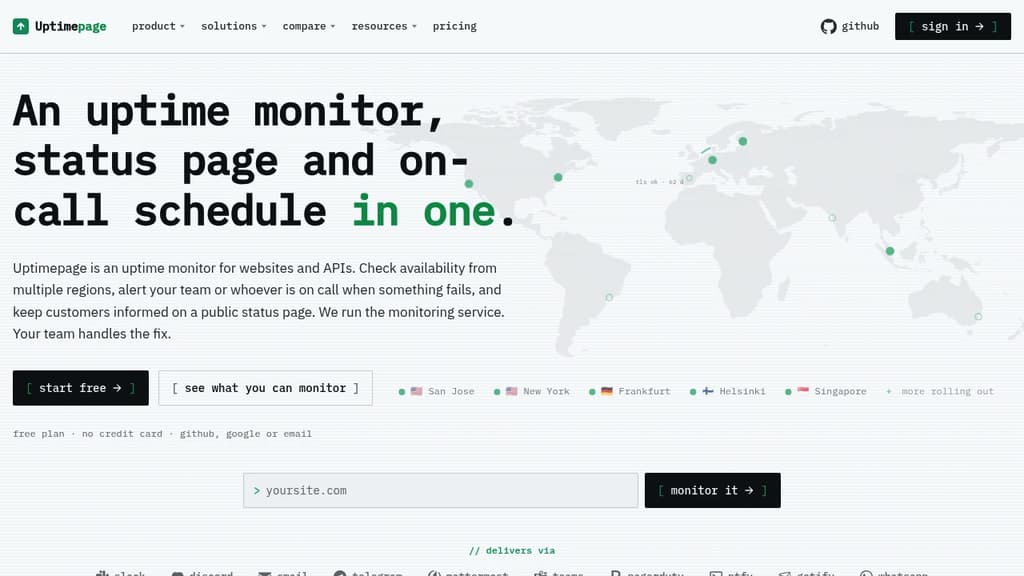
Uptimepage combines uptime monitoring, on-call scheduling, and public status pages in one hosted service. When a check fails, it alerts the right person, tracks the incident, and lets customers follow along on a branded status page. You run the fix; it runs the monitoring stack.
Eight monitor types cover the common failure modes most teams discover the hard way:
- HTTP/HTTPS checks status codes, headers, and body text from every region you pick
- TCP dials a port directly, useful for databases, mail servers, and anything without an HTTP endpoint
- DNS validates that a lookup returns the answer you expect, not just that a resolver responds
- ICMP ping confirms a host is reachable at the network layer
- Heartbeat inverts the model: your cron job calls in, and silence is the alert
- TLS certificate reads the expiry off every handshake and pages you while there's still time to renew
- Domain expiry checks the registry directly so a missed invoice doesn't take the domain down
- Browser login flow runs a real browser through your sign-in steps and charts how long each one takes, catching a broken OAuth secret that a 200 response would hide
Alerts reach Slack, Discord, Teams, PagerDuty, email, SMS, Telegram, WhatsApp, ntfy, Gotify, or any HTTPS webhook. Failure thresholds filter brief interruptions before anything gets paged.
On-call is built in. Schedules rotate people daily, weekly, or on a custom length, with overrides for holidays and swaps, and each person can subscribe to their shifts as a calendar feed. Escalation policies page channels and schedules level by level until someone acknowledges, and a policy can be bound to one monitor or set as the organization default.
Status pages publish live incidents and scheduled maintenance windows with your logo and colors. Customers can review uptime history without signing in. Maintenance windows silence the alert engine so planned work doesn't generate false pages.
For teams managing client work, a shareable monitor link gives a client or vendor a live view of one monitor's uptime, latency, and incidents, with credentials redacted and no access to anything else. Monitors and incidents export as JSON; public incidents are available over RSS. The REST API, Terraform provider, and an MCP server make the whole setup manageable as code.
The source is public under AGPL, so you can verify how it works or self-host if your requirements change. The API and Terraform provider are identical either way. Teams looking at Uptime Kuma, OpenStatus, or Healthchecks will find Uptimepage covers more of the on-call and status-page side without needing a separate tool for each.

People are looking for alternatives to...
View all alternatives
Claude Code

Spotify

CapCut

Claude
Notion

Lovable
 Windshift – The self-hosted platform that replaces Jira.

 c15t
c15t