Open Source LogRocket Alternatives
A curated collection of the 7 best open source alternatives to LogRocket.
The best open source alternative to LogRocket is Sentry. If that doesn't suit you, we've compiled a ranked list of other open source LogRocket alternatives to help you find a suitable replacement. Other interesting open source alternatives to LogRocket are: OpenReplay, OpenLLMetry, Highlight, and Helicone.
LogRocket alternatives are mainly Performance Monitoring (APM) Tools but may also be Error Tracking Tools or Monitoring & Observability Tools. Browse these if you want a narrower list of alternatives or looking for a specific functionality of LogRocket.
Written by Piotr Kulpinski


Detect, diagnose, and resolve software issues quickly with powerful error tracking, performance monitoring, and release management.
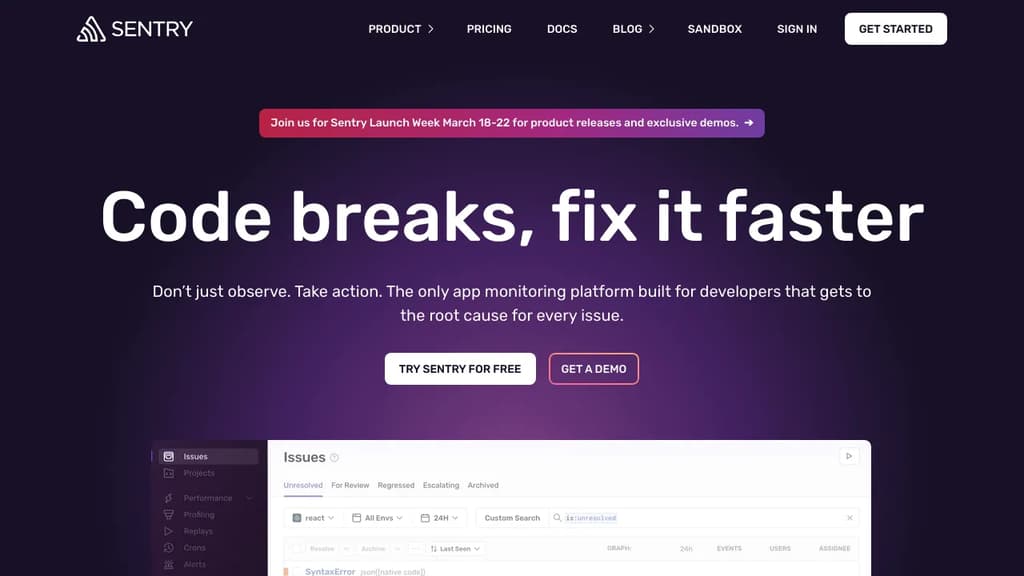
Sentry is a powerful developer-first application monitoring platform that helps teams identify, triage, and resolve software errors and performance issues in real-time. With its comprehensive suite of tools, Sentry enables developers to:
- Catch and diagnose errors instantly: Receive detailed error reports with stack traces, user context, and environment information to quickly pinpoint and fix issues.
- Monitor application performance: Track key metrics, identify bottlenecks, and optimize your code with performance monitoring and profiling tools.
- Streamline release management: Correlate errors with specific releases, track adoption rates, and manage version rollouts effectively.
- Integrate seamlessly: Connect Sentry with your existing workflow using integrations for popular development tools and platforms.
- Customize and scale: Tailor Sentry to your needs with flexible data management, custom alerting, and support for multiple programming languages and frameworks.
By providing real-time visibility into your application's health, Sentry helps teams reduce downtime, improve user experience, and ship better code faster. Whether you're working on web, mobile, or desktop applications, Sentry's robust features and intuitive interface make it an essential tool for modern software development and operations.

Capture
Capture screenshots, generate PDFs, scrape content, extract metadata, and automate browsers with one API.
Get free credits
Open-source session replay and product analytics platform you can self-host for complete control over data security, privacy, and compliance.
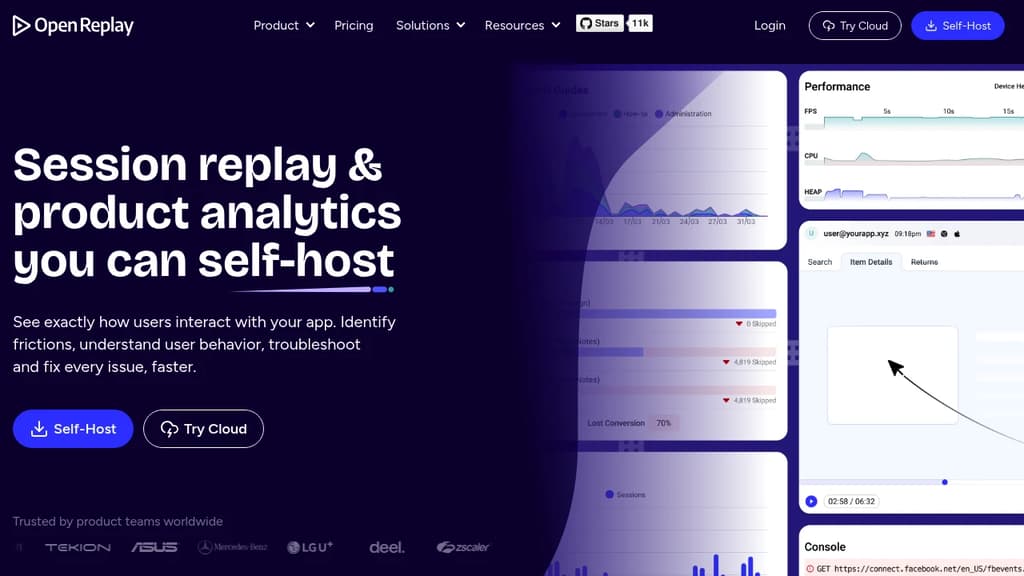
Complete visibility into user behavior with session replay technology that captures every click, scroll, and interaction in your application. See exactly how users navigate your product, identify friction points, and troubleshoot issues faster than ever before.
Self-hosted for maximum security - Deploy on your own infrastructure to maintain complete control over customer data. No third-party processors, no compliance headaches, and full alignment with the strictest regulatory standards including SOC 2 Type 2 compliance.
Comprehensive analytics suite includes:
- Session Replay - Watch user sessions like movies to understand real behavior
- Product Analytics - Funnels, user journeys, trends, and heatmaps for data-driven decisions
- Co-Browsing - Assist users in real-time with live session sharing and remote control
- Developer Tools - Built-in debugging capabilities to reproduce and fix issues instantly
Enterprise-ready platform trusted by product teams worldwide across engineering, product management, customer support, and UX research. Transform hours of debugging into minutes of targeted problem-solving with session insights that take you straight to the root cause.

Open-source observability platform for LLMs using OpenTelemetry. Monitor performance, track costs, and debug AI applications with just 2 lines of code.

Monitor and optimize your LLM applications with comprehensive observability built on OpenTelemetry standards. This open-source platform provides deep insights into your AI systems with minimal setup complexity.
Key capabilities include:
- Performance monitoring - Track response times, throughput, and system health across all LLM interactions
- Cost tracking - Monitor API usage and expenses across different LLM providers in real-time
- Error detection - Identify and debug issues in your AI applications before they impact users
- Request tracing - Follow complete request flows through your LLM pipeline for better debugging
- Multi-provider support - Works seamlessly with various LLM providers and observability platforms
Quick integration requires just 2 lines of code to start collecting telemetry data. Built on OpenTelemetry standards, ensuring compatibility with existing monitoring infrastructure and avoiding vendor lock-in.
Perfect for developers building production LLM applications who need reliable monitoring without complex setup or proprietary dependencies.

Comprehensive monitoring solution offering error tracking, session replay, and performance insights for seamless debugging and optimization.
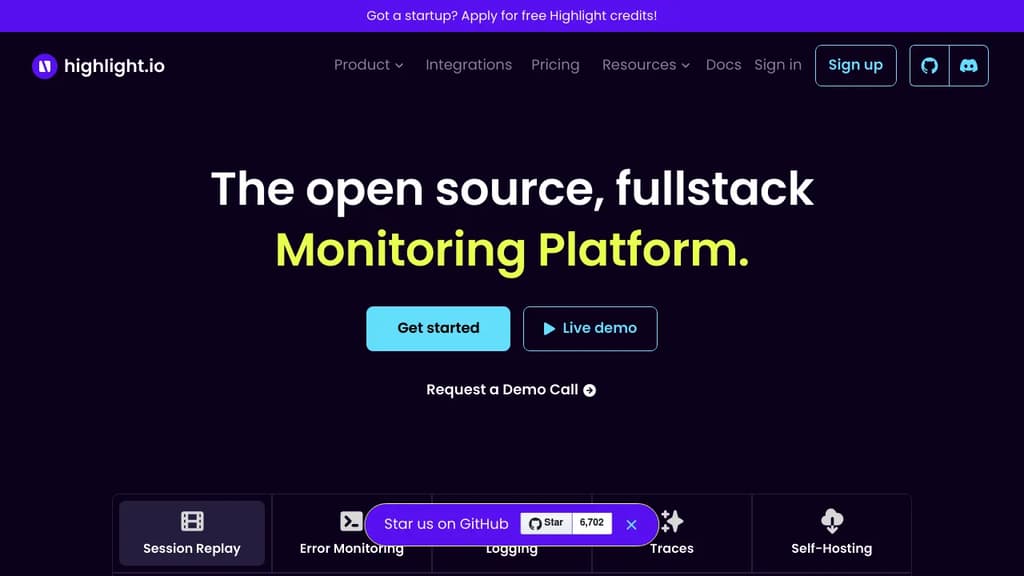
Highlight is a powerful observability platform designed to revolutionize how developers monitor and debug web applications. By combining error tracking, session replay, and performance monitoring in a single, intuitive interface, Highlight provides unparalleled insights into your application's behavior.
Key benefits of Highlight include:
- Error Tracking: Instantly capture and diagnose errors with detailed stack traces, error context, and affected user information.
- Session Replay: Visualize user interactions with pixel-perfect recreations of sessions, helping you understand and reproduce issues quickly.
- Performance Monitoring: Gain deep insights into your application's performance with metrics on load times, API calls, and resource usage.
- Real-time Alerts: Stay informed about critical issues with customizable alerts delivered via email, Slack, or other integrations.
- Easy Integration: Get started in minutes with simple SDK integration for popular frameworks and languages.
- Privacy-focused: Ensure data protection with automatic PII redaction and customizable data retention policies.
Highlight empowers development teams to identify, prioritize, and resolve issues faster, leading to improved application stability and enhanced user experiences. With its comprehensive feature set and user-friendly interface, Highlight is the go-to solution for modern web application observability.

Open-source platform for logging, monitoring, and debugging LLM applications. Route, debug, and analyze AI apps with comprehensive observability tools.

Helicone is the open-source platform that helps developers build reliable AI applications through comprehensive observability. Trusted by the world's fastest-growing AI companies, it provides essential tools for routing, debugging, and analyzing LLM applications.
Key Features:
- Universal Integration: Access 100+ models with a single integration (beta)
- Complete Observability: Log, monitor, and debug your AI applications
- Advanced Analytics: Track requests, segments, sessions, and user properties
- Developer Tools: Prompts playground, experiments, evaluators, and datasets
- Enterprise Ready: Scalable solution for growing AI companies
The platform offers a comprehensive dashboard for monitoring AI application performance, with detailed request tracking and user analytics. Developers can experiment with prompts, run evaluations, and manage datasets all within one unified interface.
Getting Started: No credit card required with a 7-day free trial. The platform is designed to help developers quickly identify issues, optimize performance, and ensure their AI applications run reliably at scale.

Logfire offers intuitive observability tools for Python applications, combining logs, profiling, and telemetry in one platform.
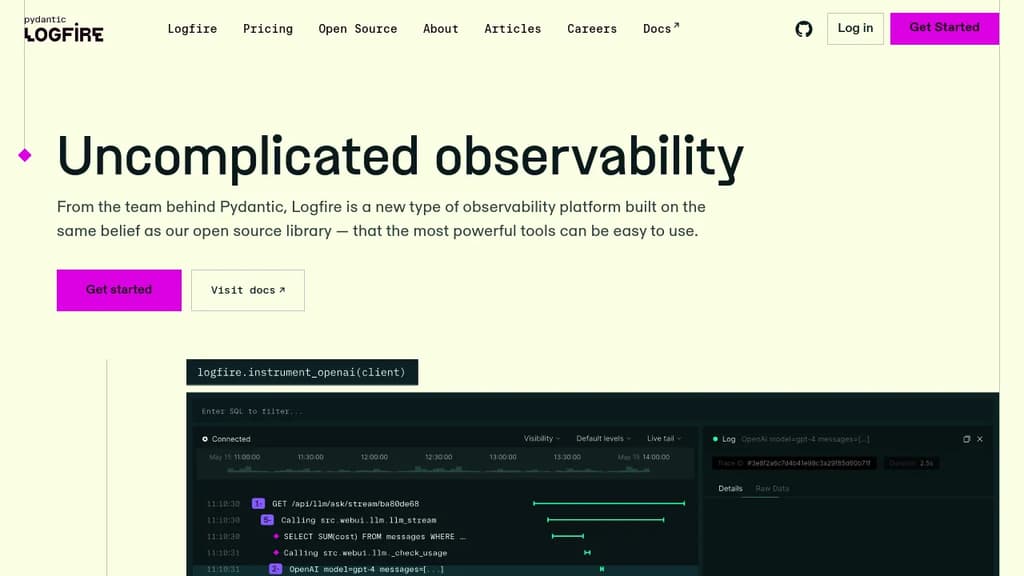
Logfire brings powerful observability to Python applications with remarkable simplicity. Built by the team behind Pydantic, it offers developers an intuitive way to gain deep insights into their code.
Key features:
- Seamless integration: Easy setup with popular Python libraries and frameworks
- Comprehensive visibility: Monitor logs, traces, and performance metrics in one place
- Structured data: Query-ready logs for easy analysis and visualization
- Manual tracing: Create custom logs and traces with a modern, user-friendly interface
- OpenTelemetry support: Leverage the power of OTel with simplified implementation
Logfire transforms complex observability tasks into actionable insights. Whether you're building AI tools or cloud-based applications, it provides a clear window into your code's behavior. With features like performance profiling and full execution tracing, Logfire helps developers quickly identify and resolve issues.
The platform's intuitive design makes it accessible for teams of all sizes, eliminating the need for dedicated observability experts. By combining ease of use with powerful analytics capabilities, Logfire empowers developers to make data-driven decisions and continuously improve their applications.

Sent
Messaging Infrastructure for Developers. One API for SMS, WhatsApp, and RCS across 190+ countries.
Get Started Free
Bugsink offers real-time error tracking with self-hosting capabilities, allowing easy installation and connection to any app using Sentry-compatible SDKs.
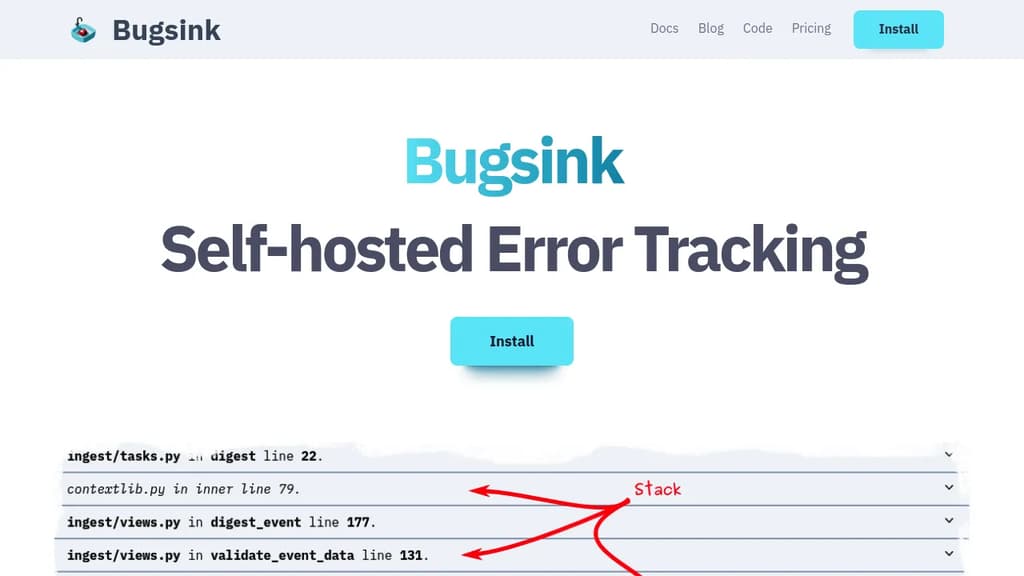
Bugsink is a powerful self-hosted error tracking solution designed for developers who want full control over their error monitoring infrastructure. With Bugsink, you can easily install the platform on your own servers and connect any application using Sentry-compatible SDKs.
Key features of Bugsink include:
- Self-hosted control: Install Bugsink on your own servers for complete data ownership and privacy.
- Real-time error tracking: Get instant notifications about errors in your applications as they occur.
- Sentry SDK compatibility: Seamlessly integrate with most popular programming languages using existing Sentry SDKs.
- Scalable performance: Handle millions of events daily without failure, ensuring reliability when you need it most.
- Comprehensive error details: Access all the information needed to triage and fix errors in one centralized location.
- Easy installation: Follow detailed instructions to get up and running quickly.
Bugsink empowers development teams to maintain high-quality applications by providing a robust, scalable, and self-controlled error tracking solution. Whether you're managing a small project or a large-scale application, Bugsink offers the tools you need to identify, analyze, and resolve issues efficiently.
 c15t
c15tPeople are looking for alternatives to...