Stars
Forks
Last commit
Stars
Forks
Last commit
Stars
Forks
Last commit
Stars
Forks
Last commit
Stars
Forks
Last commit
Stars
Forks
Last commit
Stars
Forks
Last commit
Stars
Forks
Last commit
Stars
Forks
Last commit
Stars
Forks
Last commit
Stars
Forks
Last commit
Stars
Forks
Last commit
The best open source alternative to Chartbrew is Apache Superset. If that doesn't suit you, we've compiled a ranked list of other open source Chartbrew alternatives to help you find a suitable replacement. Other interesting open source alternatives to Chartbrew are: OpenBB, Grafana, Metabase, and Redash.
Chartbrew alternatives are mainly BI Platforms but may also be Data Visualization Tools or Financial Data Platforms. Browse these if you want a narrower list of alternatives or looking for a specific functionality of Chartbrew.
Connect any SQL database, build charts with drag-and-drop or raw SQL, and publish interactive dashboards without writing application code.
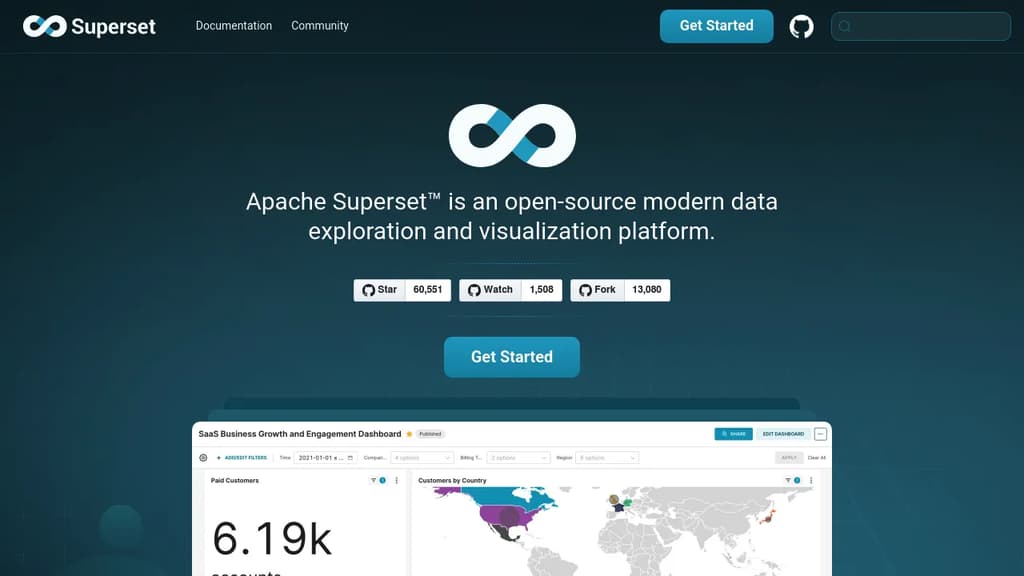
Apache Superset is a data exploration and visualization platform built for teams who want self-serve analytics without depending on a data engineering team for every report. It works with any SQL-based database, from small Postgres instances to petabyte-scale cloud warehouses, and doesn't require a separate data ingestion layer.
The tool serves two kinds of users at once. Analysts who prefer a visual interface can use the drag-and-drop chart builder to assemble dashboards without writing a line of SQL. Those who want more control get SQL Lab, a full-featured SQL IDE with database metadata browsing, Jinja templating, and the ability to save query results as virtual datasets for further exploration.
Key capabilities include:
Compared to lighter tools like Metabase or Redash, Superset leans toward teams that need more customization and are comfortable managing their own deployment. It's self-hostable under the Apache License, which makes it a common choice for organizations that can't send data to a third-party SaaS. Grafana covers similar dashboard territory but focuses heavily on time-series and metrics rather than general SQL exploration.
Superset scales horizontally and is designed to sit on top of your existing data infrastructure rather than replace it.
Connects proprietary, licensed, and public financial data with AI agents in a self-hostable workspace for asset managers, hedge funds, and banks.
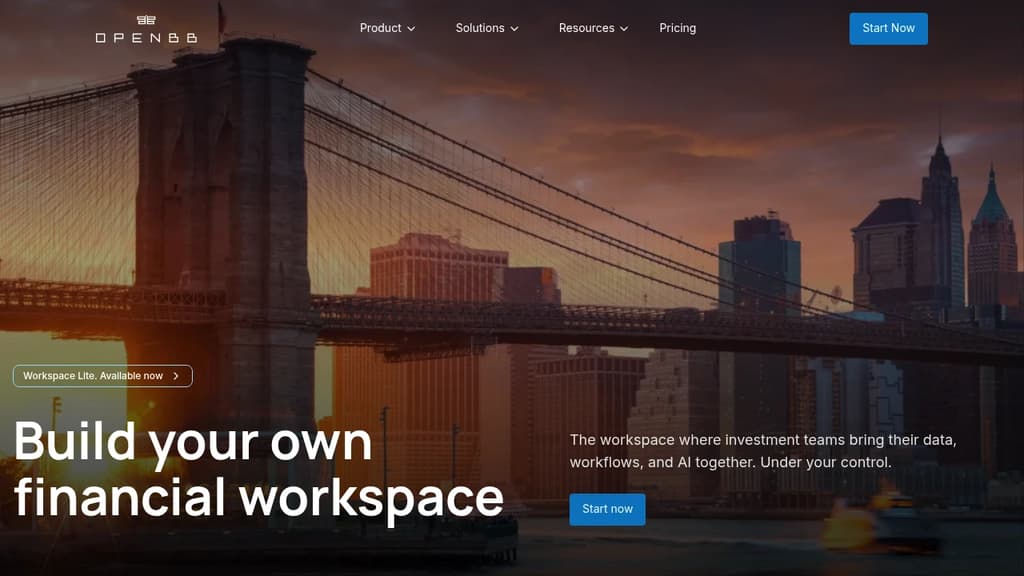
OpenBB is an agentic workspace designed for investment teams that need to bring fragmented data sources and AI tools together without building custom infrastructure from scratch. It targets asset managers, hedge funds, and banks that want production-ready analytics applications without months of engineering work.
The core idea is straightforward: your firm already has proprietary data, licensed feeds, and internal tools. OpenBB provides the layer that connects all of it, structured and unstructured alike, and makes it available to AI agents in a controlled, auditable environment. Think of it as an alternative to tools like Hebbia but built around a fully self-hostable, open-source foundation.
Key capabilities include:
Workflows span public equity research, private equity due diligence, credit risk, crypto analysis, commodities, and client advisory. Analysts can automate earnings intelligence extraction, generate investment notes from call transcripts, run portfolio stress tests, and draft investor letters, all from a single interface.
For teams already experimenting with AI agent frameworks or workflow automation, OpenBB provides the finance-specific context layer those tools lack. The workspace is designed for experimentation and production deployment simultaneously, so prototypes don't need to be rebuilt before going live.
Data privacy is a genuine differentiator here. AI models can run locally, prompts stay inside your environment, and your positions never touch an external training pipeline.
Grafana is a multi-platform open source analytics and interactive visualization web application that provides charts, graphs, and alerts for the web.
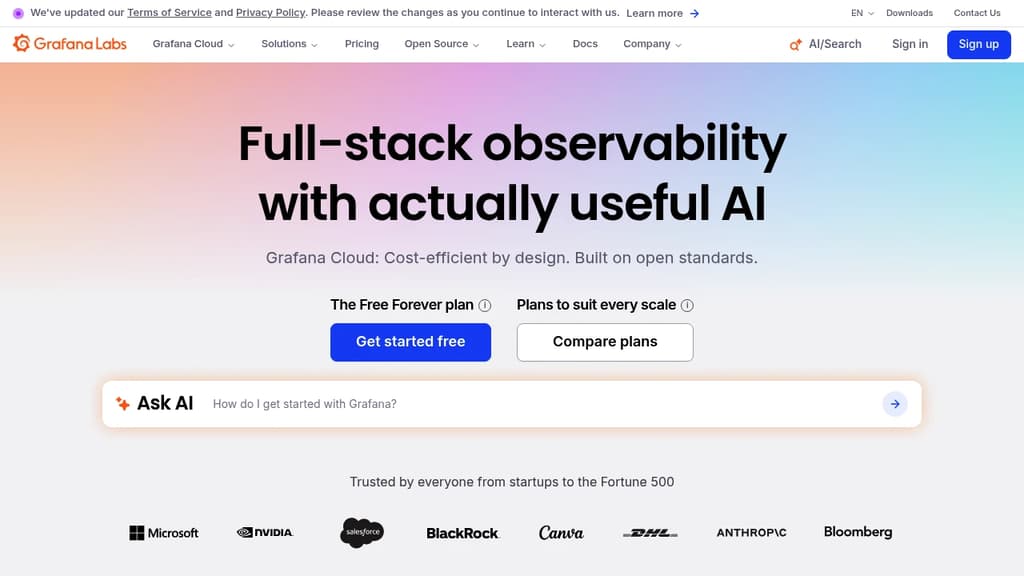
Grafana is a powerful and versatile open-source platform for data visualization and monitoring. It allows users to query, visualize, alert on, and understand metrics no matter where they are stored. Key features include:
Support for multiple data sources: Grafana can connect to various databases and time series data stores, including Prometheus, InfluxDB, Elasticsearch, and many more.
Customizable dashboards: Users can create rich, interactive dashboards with a wide range of visualization options, from simple line graphs to complex heatmaps.
Alerting system: Grafana includes a flexible alerting engine that can notify users when specific conditions are met in their data.
Plugin ecosystem: Extend Grafana's functionality with a wide range of community-contributed and official plugins.
User management and authentication: Grafana offers built-in user authentication and supports various external authentication providers.
Templating and variables: Create dynamic dashboards that adapt to different contexts and data sets.
Grafana is widely used in various industries for monitoring infrastructure, applications, and business metrics. It's known for its flexibility, ease of use, and ability to bring together data from multiple sources into a single, cohesive view.
Open-source business intelligence platform for data exploration, visualization, and sharing. Empowers teams to make data-driven decisions effortlessly.

Metabase is an open-source business intelligence and analytics platform that transforms how organizations interact with their data. It offers a seamless blend of power and simplicity, making it an ideal choice for companies of all sizes.
Key benefits of Metabase include:
Whether you're a small startup or a large enterprise, Metabase provides the tools you need to turn your data into actionable insights, driving informed decision-making across your organization.
Redash is an open-source data visualization and analytics platform that helps teams make sense of their data through SQL queries and interactive dashboards.
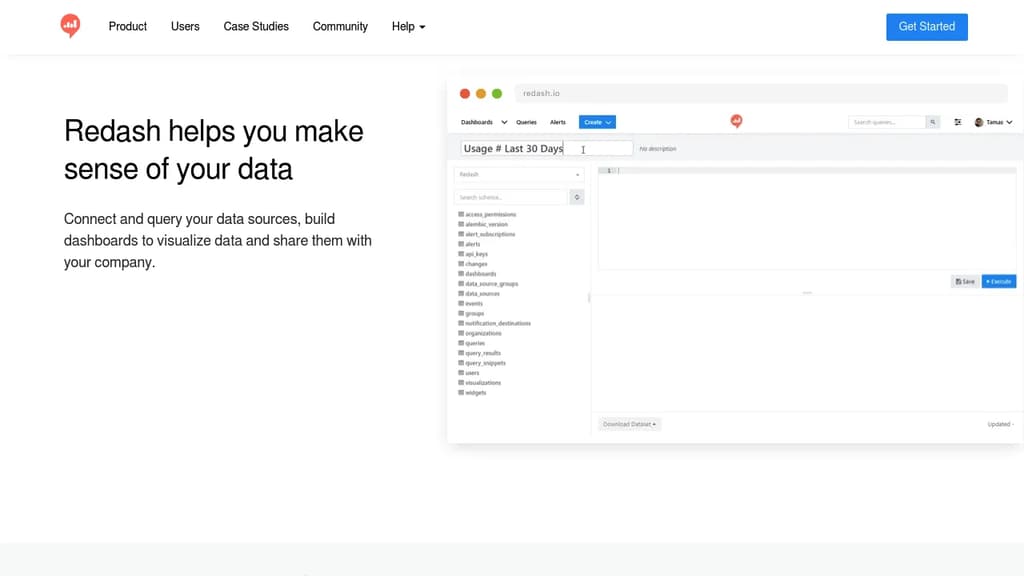
Redash is a powerful, open-source data visualization and analytics platform designed to help teams connect, query, visualize, and share their data effectively. Here's what makes Redash stand out:
Versatile Data Connectivity:
Powerful Query Editor:
Interactive Dashboards:
Collaboration and Sharing:
Visualizations and Alerts:
Open-Source Advantage:
API Access:
Redash is trusted by data-driven companies to make sense of their information, enabling better decision-making and deeper understanding of their data. Whether you're a small startup or a large enterprise, Redash provides the tools you need to turn your data into actionable insights.
Self-serve analytics platform that transforms dbt models into interactive dashboards, enabling data-driven decisions across organizations.
Lightdash revolutionizes business intelligence for data teams leveraging dbt. This open-source platform seamlessly integrates with your existing data stack, allowing you to create powerful dashboards and explore data with ease.
Key benefits of Lightdash include:
Lightdash bridges the gap between data engineering and business users, fostering a data-driven culture across your organization. By leveraging your existing dbt models, it ensures a single source of truth and accelerates time-to-insight for all stakeholders.
Create data-driven websites and reports using SQL and Markdown, with automatic visualizations and interactive elements.
Evidence is a powerful open-source tool that bridges the gap between data analysis and presentation. It allows you to create stunning, interactive data stories and reports directly from your SQL queries and Markdown files.
Key benefits of Evidence include:
Whether you're a data analyst, business intelligence professional, or developer, Evidence empowers you to create professional-grade data presentations without the need for complex BI tools or web development expertise.
Connect multiple data sources, build complex queries, create insightful visualizations, and organize powerful dashboards to make informed business decisions.
Frappe Insights is a comprehensive open-source business intelligence tool that transforms how organizations handle their data analytics needs.
Key features include:
The platform is designed to help businesses overcome the challenge of scattered data by providing a unified solution for data analysis. Its user-friendly interface makes complex data operations accessible to both technical and non-technical users, enabling teams to make data-driven decisions more efficiently.
Self-hosted runtime that pulls GA4, Meta Ads, PostHog, Stripe, and X into a local-first data layer you control, with no data leaving your machine.
Infinite is a self-hosted runtime for marketers and founders who want all their data in one place without handing it to another SaaS platform. It connects GA4, Meta Ads, PostHog, Stripe, and X, then stores everything locally so you query it directly.
The core idea is ownership. Most marketing analytics tools aggregate your data on their servers, charge for access, and limit what you can do with it. Infinite flips that: the data layer lives on your machine, you control the schema, and nothing is sent to a third party.
Key integrations out of the box:
Bringing these sources together locally means you can correlate ad spend with actual revenue, or tie PostHog product events to acquisition channels, without exporting CSVs or stitching together dashboards across five tabs.
It's built for early-stage startups that already use several of these tools but lack a unified view. The self-hosted, MIT-licensed model means no per-seat pricing and no vendor lock-in. If you're already running something like Beam for data pipelines, Infinite targets a similar philosophy: your infrastructure, your rules.
The local-first architecture is the clearest differentiator. Queries run against data on your own hardware, which matters for teams handling sensitive revenue or user data under privacy constraints.

Messaging Infrastructure for Developers. One API for SMS, WhatsApp, and RCS across 190+ countries.
Get Started Free
Open-source cookie banner, built for control and lightening fast modern web apps.
Get Started in 30 seconds Sevalla