drawDB vs Mermaid
Learn how drawDB and Mermaid differ in their key features, development activity, technology
stack and community adoption, so you can decide which of these data visualization tools is best for you.
Learn how drawDB and Mermaid differ in their key features, development activity, technology stack and community adoption, so you can decide which of these data visualization tools is best for you.

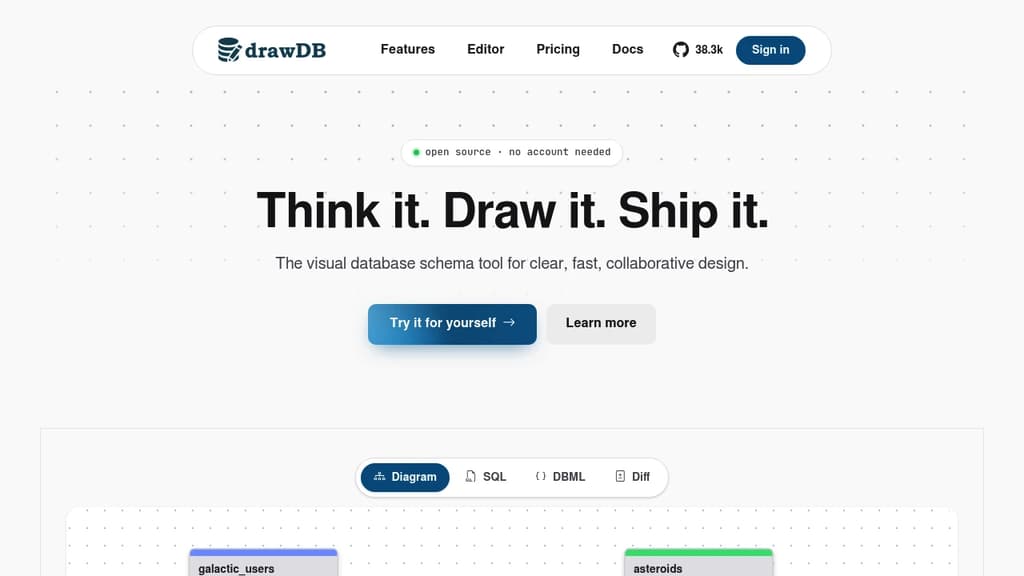
drawDB
Last 30 days
Last commit
13 hours agoRepository age
3 yearsLicense
AGPL-3.0Self-hosted
YesRepository
drawdb-io/drawdb

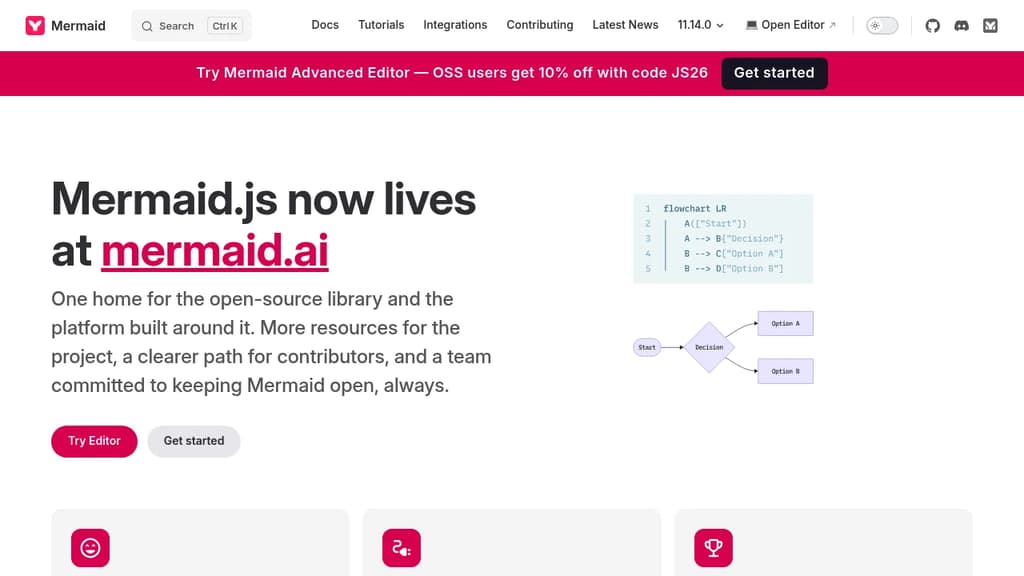
Mermaid
Last 30 days
Last commit
3 hours agoRepository age
12 yearsVersion
12.2.0License
MITRepository
mermaid-js/mermaid
Detailed Comparison
Both drawDB and Mermaid have their unique strengths and serve similar purposes effectively. Consider your specific needs regarding popularity, growth, activity, technology, maturity, licensing and features when making your decision.
Both drawDB and Mermaid have their unique strengths and serve similar purposes effectively. Consider your specific needs regarding popularity, growth, activity, technology, maturity, licensing and features when making your decision.
Community & Popularity
Mermaid leads in popularity with 90,839 stars vs 40,120 stars for drawDB. The 126% higher star count indicates stronger community adoption. In terms of developer contributions, Mermaid has 9,392 forks, indicating strong developer engagement.
Growth Momentum
drawDB is growing faster, adding 422 stars in the last 30 days (+1.1%) against adding 424 stars for Mermaid (+0.5%). drawDB is the smaller project of the two, so it is closing the gap rather than extending a lead.
Development Activity
Both projects show recent activity, with drawDB last updated 13 hours ago and Mermaid 3 hours ago.
Technology Stack
Both tools share common technology foundations, being built with JavaScript, CSS. However, they differ in their additional technology choices: drawDB uses JSX while Mermaid leverages Typescript, Vue.
Project Maturity
Mermaid has been in development longer, starting 12 years ago, compared to drawDB which began 3 years ago. This 8.8-year head start suggests Mermaid may have more mature features and established processes.
Licensing
Mermaid uses the MIT license, which is more permissive than drawDB's AGPL-3.0 license, potentially offering greater flexibility for commercial use and integration.
Use Cases & Features
Both tools serve similar use cases in Data Visualization. However, they also have distinct specializations: drawDB also focuses on Database Tools & GUIs.
Hosting & Deployment
drawDB provides self-hosting options for complete data control and customization, while Mermaid may be primarily cloud-based or require different deployment approaches.


 InfluxDB – The purpose-built time series platform for high-velocity ingestion and real-time queries at scale.