Open Source Atlassian Statuspage Alternatives
A curated collection of the 11 best open source alternatives to Atlassian Statuspage.
The best open source alternative to Atlassian Statuspage is Cachet. If that doesn't suit you, we've compiled a ranked list of other open source Atlassian Statuspage alternatives to help you find a suitable replacement. Other interesting open source alternatives to Atlassian Statuspage are: Gatus, OpenStatus, OneUptime, and Kener.
Atlassian Statuspage alternatives are mainly Status Pages but may also be Uptime Monitoring Tools or Infrastructure Monitoring Tools. Browse these if you want a narrower list of alternatives or looking for a specific functionality of Atlassian Statuspage.

Written by Piotr Kulpinski


Open-source status page platform that helps organizations communicate system status and incidents effectively with customizable components and metrics tracking
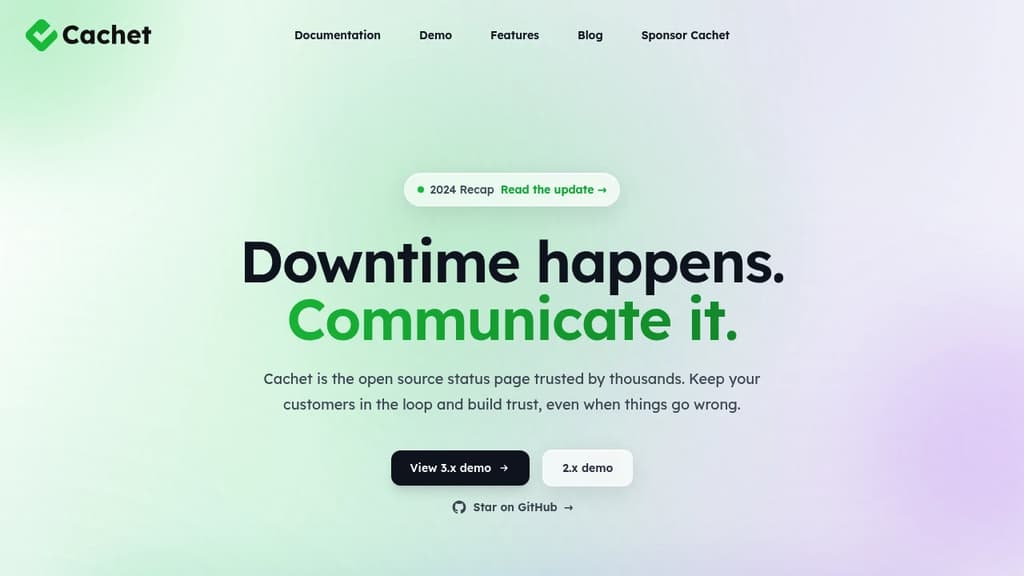
Cachet is a powerful open-source status page system that enables organizations to maintain transparent communication during outages and maintenance. With features like component status tracking, metric visualization, and incident management, teams can keep stakeholders informed in real-time.
Key benefits include:
- Beautiful, responsive design that works seamlessly across all devices
- Multilingual support with over 10 languages available
- Powerful JSON API for automation and integration
- Proactive maintenance scheduling to plan and communicate upcoming work
- Flexible metrics for tracking custom indicators and data points
- Enhanced security with two-factor authentication support
Used by major organizations like Boeing, Siemens, and GNOME, Cachet helps streamline downtime communication while building trust through transparency. The system is highly customizable and can be self-hosted, giving organizations complete control over their status page infrastructure.

A highly customizable monitoring solution that provides automated status pages, extensive alerting options, and detailed testing capabilities for your services and infrastructure
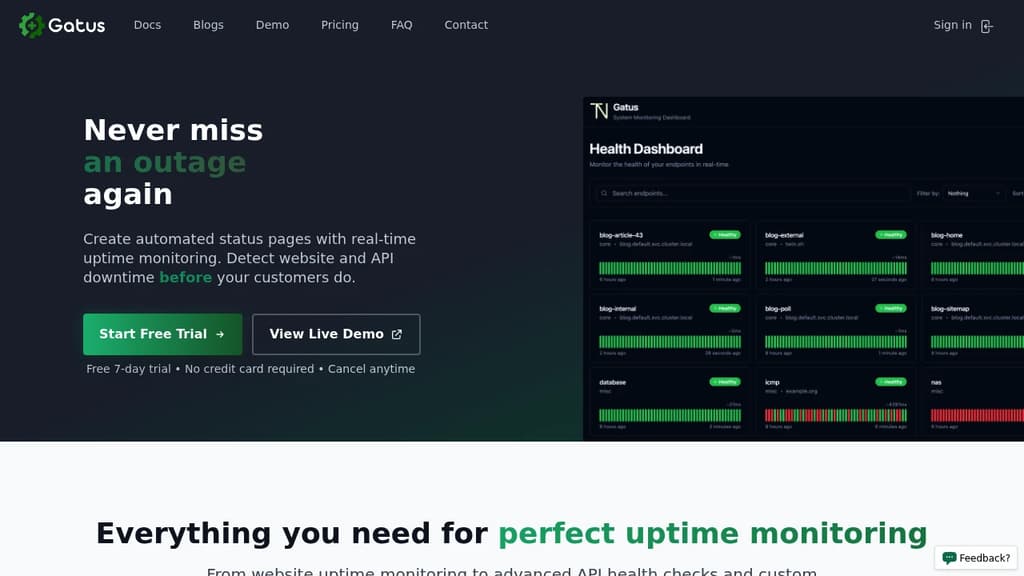
Gatus is a powerful monitoring solution that helps you keep track of your infrastructure's health in real-time. The platform offers comprehensive monitoring capabilities for HTTP, GraphQL, DNS, ICMP/PING, TCP, and certificate expiration checks.
Key features include:
- Highly customizable monitoring with conditions for response time, body content, and IP addresses
- Extensive alerting system supporting Email, Slack, PagerDuty, Teams, Twilio, Discord, and more
- Developer-focused approach with detailed insights and automated user acceptance testing
- Real-time status updates that automatically reflect your services' current state
- Customer-centric design providing clear, accurate information about ongoing issues
The platform stands out by being completely open source, allowing for community contributions and custom feature development. Unlike traditional status pages that only show historical uptime, Gatus focuses on providing immediate, actionable information about current service status.

Open-source status page and uptime monitor that tracks endpoints from 28 global regions, communicates incidents, and helps satisfy SOC 2 audit requirements.
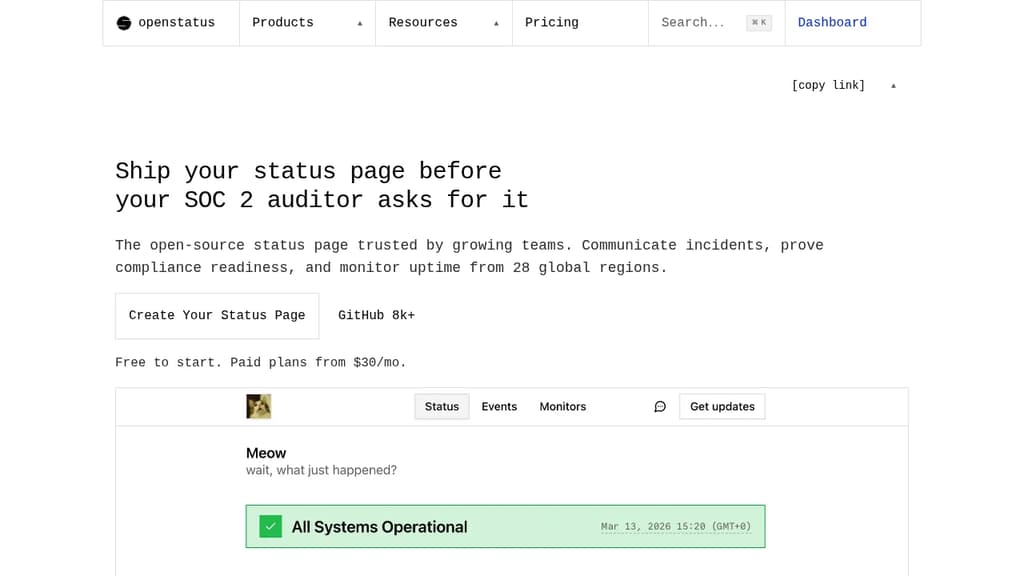
OpenStatus combines a branded status page with uptime monitoring into one tool. It's aimed at teams that need to communicate incidents clearly to users and demonstrate that process to auditors. The free plan covers one monitor and one status page. Paid plans start at $30/month.
Monitoring runs from 28 regions across three cloud providers, covering Europe, North America, South America, Asia, Africa, and Oceania. HTTP endpoints (REST or GraphQL) are checked on a schedule, and alerts fire to Slack, Discord, PagerDuty, email, or webhooks the moment something fails. The status page updates automatically during incidents.
For SOC 2 compliance, every status report is timestamped and stored automatically. That gives auditors a documented trail of how incidents were communicated. Status pages support custom domains, public or password-protected access, maintenance windows, and subscriber notifications via email or RSS.
Every dashboard action is also available through the API. Teams can manage monitors via a CLI, a typed HTTP API, a Terraform provider, or an MCP server that connects to Claude, ChatGPT, or Cursor. Monitor configurations can be versioned in YAML and applied through CI/CD pipelines.
It's fully open source and self-hostable via a small Docker image. Private monitoring locations can be deployed behind a firewall to check internal services. If you're comparing options, Statusnook and Cachet are worth a look for self-hosted setups, while Atlassian Statuspage is the common hosted alternative.

All-in-one solution for uptime monitoring, incident management, and status pages to keep your services running smoothly
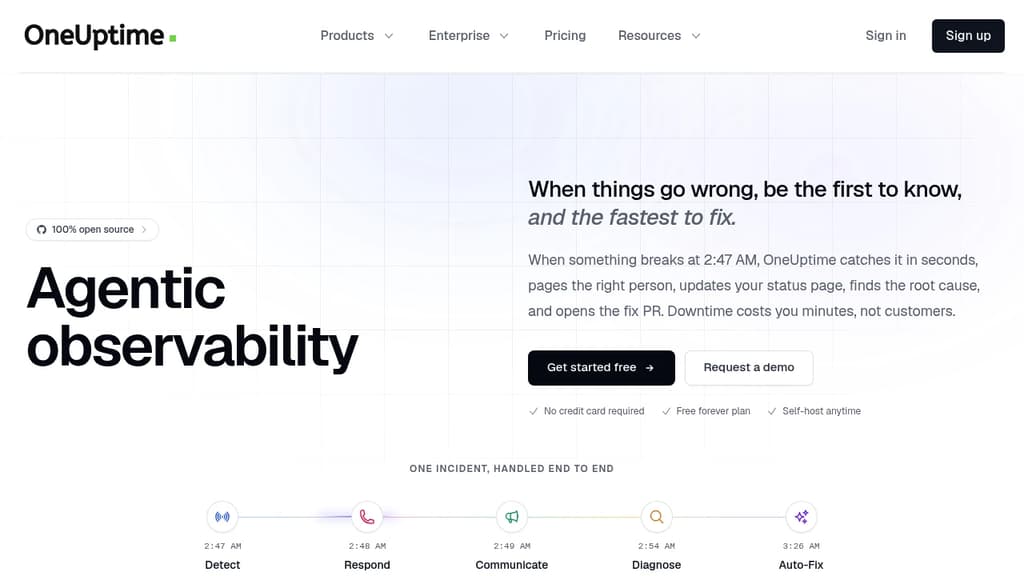
OneUptime is a powerful, open-source platform designed to help businesses maintain optimal service reliability and performance. By combining essential features into a single, intuitive solution, OneUptime streamlines your operations and enhances your ability to respond to issues quickly and effectively.
Key benefits of OneUptime include:
- Unified Monitoring: Keep track of your entire infrastructure with comprehensive uptime monitoring for websites, APIs, and servers.
- Proactive Alerts: Receive instant notifications through various channels when issues arise, allowing for rapid response and minimized downtime.
- Incident Management: Efficiently handle and resolve incidents with built-in tools for team collaboration, task assignment, and progress tracking.
- Custom Status Pages: Create branded, real-time status pages to keep your customers informed about service availability and ongoing incidents.
- Performance Insights: Gain valuable insights into your system's performance with detailed metrics and analytics.
- Flexible Integrations: Seamlessly integrate with popular tools and services to enhance your existing workflow.
- Open-Source Advantage: Benefit from community-driven development, transparency, and the ability to customize the platform to your specific needs.
With OneUptime, you can ensure your services remain reliable, your team stays informed, and your customers experience minimal disruption. Whether you're a small startup or a large enterprise, OneUptime provides the tools you need to maintain high availability and build trust with your users.

Free, open-source status page and uptime monitor with Docker deployment. Track 11 service types, manage incidents, schedule maintenance, and notify subscribers instantly.
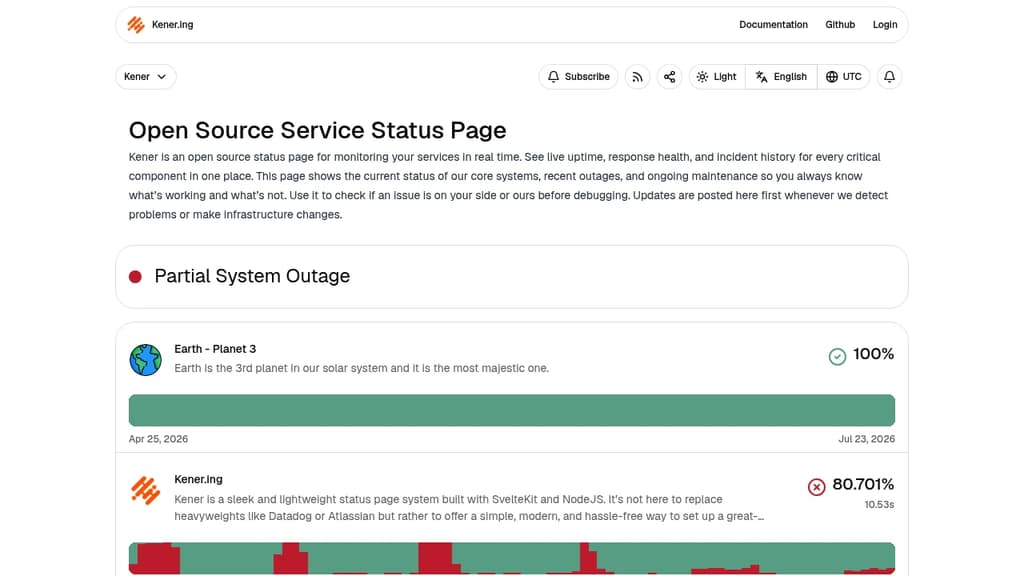
Kener is a free, open-source status page solution built with Svelte and TailwindCSS that gets you operational in under 2 minutes. Deploy via Docker and start monitoring your services immediately without complex setup or expensive infrastructure.
Key capabilities include:
- Support for 11 different service types to match your infrastructure
- Real-time incident management and status updates
- Scheduled maintenance notifications to keep users informed
- Subscriber notifications for status changes and updates
- Beautiful, responsive design that works on all devices
- Full source code access for customization and self-hosting
Perfect for teams that need reliable service monitoring without vendor lock-in or recurring costs. Whether you're running a small startup or managing multiple services, Kener provides the essential tools to communicate system status transparently to your users. The Docker-ready setup means you can have a professional status page running on your own infrastructure within minutes, giving you complete control over your monitoring data and user communications.

Self-hostable platform combining website analytics, uptime monitoring, server status, Docker tracking, status pages, and telemetry for indie developers and small teams.
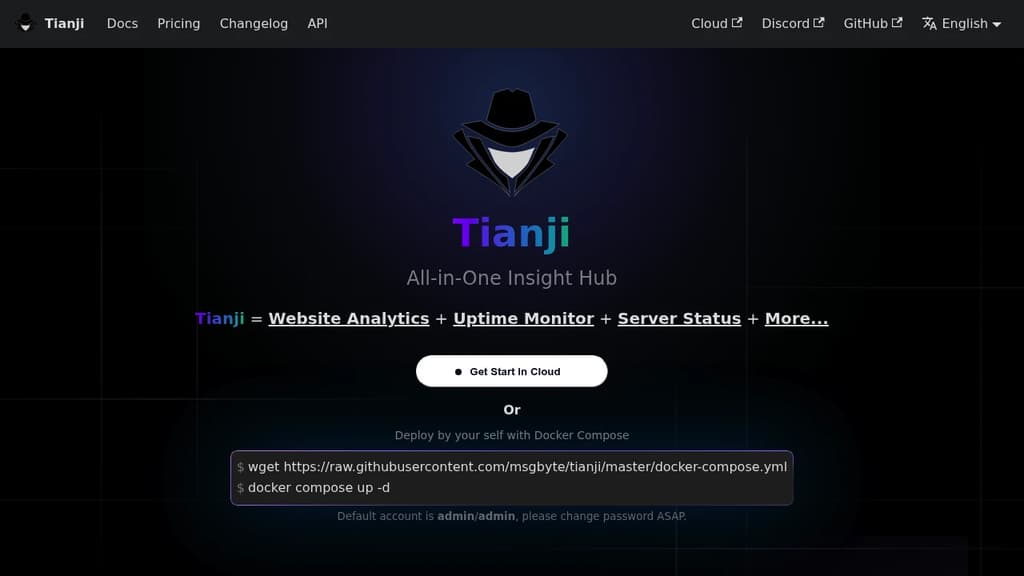
Tianji bundles several tools that teams typically run separately: website analytics, uptime monitoring, server status, and more, all in a single self-hosted platform. It's built for independent developers and small teams who want visibility across their stack without stitching together multiple services.
The analytics side tracks visitors without cookies, so you skip the consent banner headache entirely. It's GDPR and CCPA compliant by design, not as an afterthought.
Beyond analytics, Tianji covers a lot of ground:
- Website analytics – cookieless visitor tracking with no consent prompts required
- Uptime monitoring – track whether your sites and services are up, similar to what you'd get from a dedicated tool like Uptime Kuma
- Server status – monitor resource usage across your servers
- Docker status – visibility into running containers
- Status pages – public-facing pages to communicate incidents, comparable to Kener or OpenStatus
- Telemetry – custom event tracking beyond pageviews
- Surveys – lightweight data collection built in
- Feeds – notification and activity feeds
Tianji exposes a full OpenAPI interface, so you can pull data into other tools or automate workflows without being locked into the UI.
The project is community-driven and explicitly aimed at lightweight needs. It doesn't try to match the feature depth of enterprise monitoring platforms. That's intentional. The goal is a single deployable that covers the common bases for a solo developer or small team, at low operational cost and complexity.

Open-source uptime monitoring solution with real-time alerts, status pages, and comprehensive checks for websites, APIs, databases, and services.
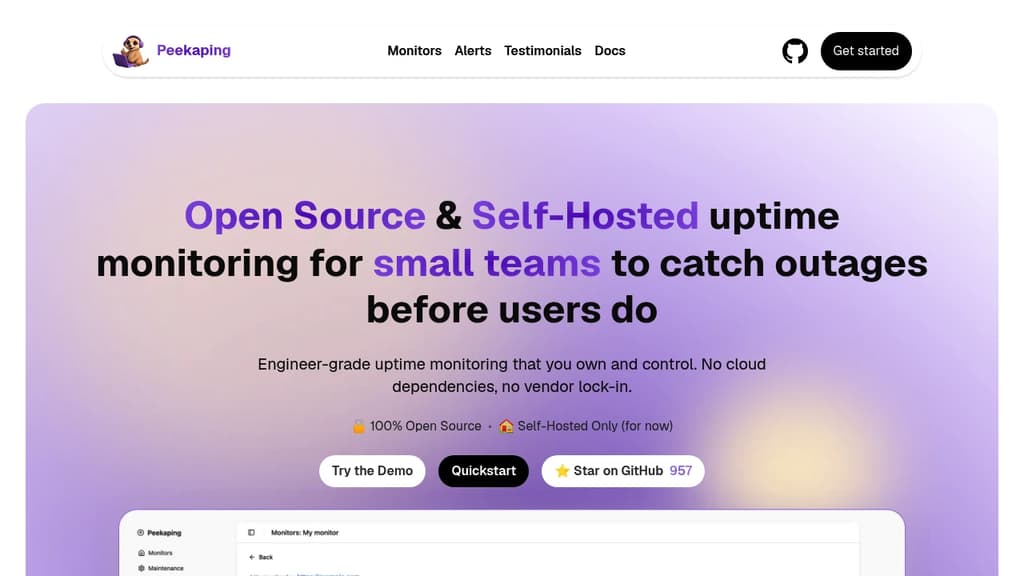
Complete infrastructure monitoring that runs entirely on your servers with zero vendor lock-in. Built with Go and React for high performance and reliability.
Comprehensive monitoring capabilities include HTTP/HTTPS websites, TCP ports, DNS queries, databases (PostgreSQL, MongoDB, Redis), Docker containers, gRPC services, and message brokers like RabbitMQ and Kafka. Push-based monitoring via webhooks lets services report their own health status.
Instant notifications through 15+ channels including Telegram, Slack, Discord, Email, PagerDuty, and Opsgenie. Configure alerts by severity and team workflows to reduce noise and ensure rapid response times.
Beautiful status pages can be public for customers or private for internal teams. Display real-time service status, uptime metrics, and incident history in a clean, professional interface that builds trust and reduces support tickets.
Flexible deployment options with official Docker images, docker-compose setup, or bare metal installation. Choose your database backend: SQLite for simple setups, PostgreSQL or MongoDB for production workloads.
API-first architecture with complete Swagger/OpenAPI documentation enables automation and custom integrations. Two-factor authentication, brute-force protection, and SSL certificate monitoring ensure security.
MIT-licensed and completely free for personal and commercial use. No usage limits, no feature restrictions, no data leaving your infrastructure.

A powerful open-source status page system for real-time incident tracking, maintenance updates, and transparent communication with users.
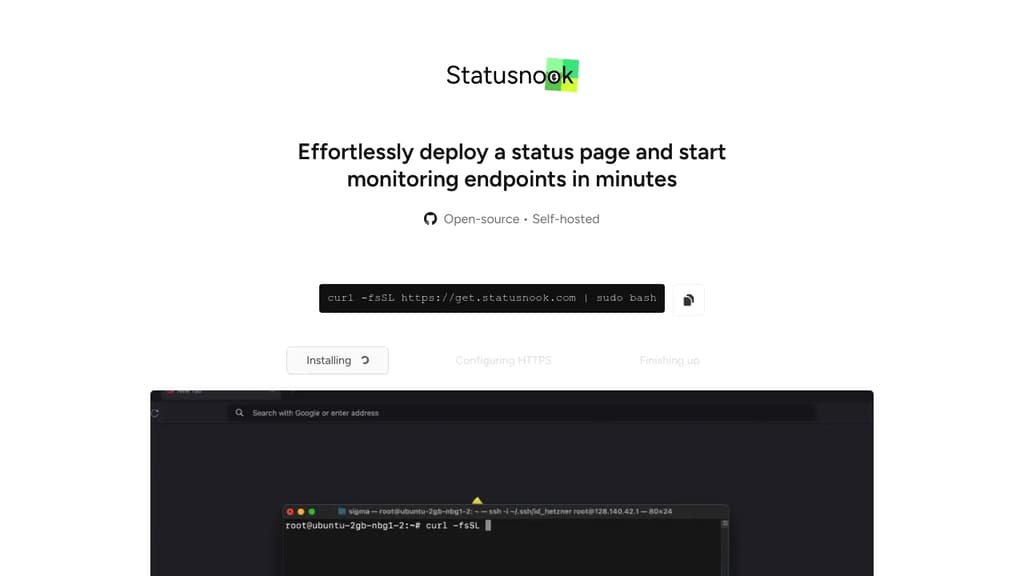
Statusnook is an advanced open-source status page system designed to help organizations maintain clear and effective communication with their users about service health and incidents. With its robust features and user-friendly interface, Statusnook enables teams to:
- Provide real-time updates on service status and performance
- Manage and communicate incidents efficiently
- Schedule and announce planned maintenance
- Customize status pages to match brand identity
- Integrate with popular monitoring and alerting tools
Key benefits of using Statusnook include:
- Enhanced transparency: Keep users informed about service status, reducing support inquiries and building trust.
- Improved incident management: Streamline the process of reporting, updating, and resolving issues.
- Flexible customization: Tailor the status page to fit your brand and specific needs.
- Multi-channel notifications: Reach users through various channels, including email, SMS, and webhooks.
- Historical data and analytics: Gain insights into service performance and incident patterns over time.
Whether you're running a small application or managing a complex infrastructure, Statusnook provides the tools you need to maintain clear, professional communication about your services' health and performance.

Deploy your own uptime and performance monitoring with HTTP/ICMP checks, multi-region probes, and custom status pages. MIT licensed, runs on minimal hardware.
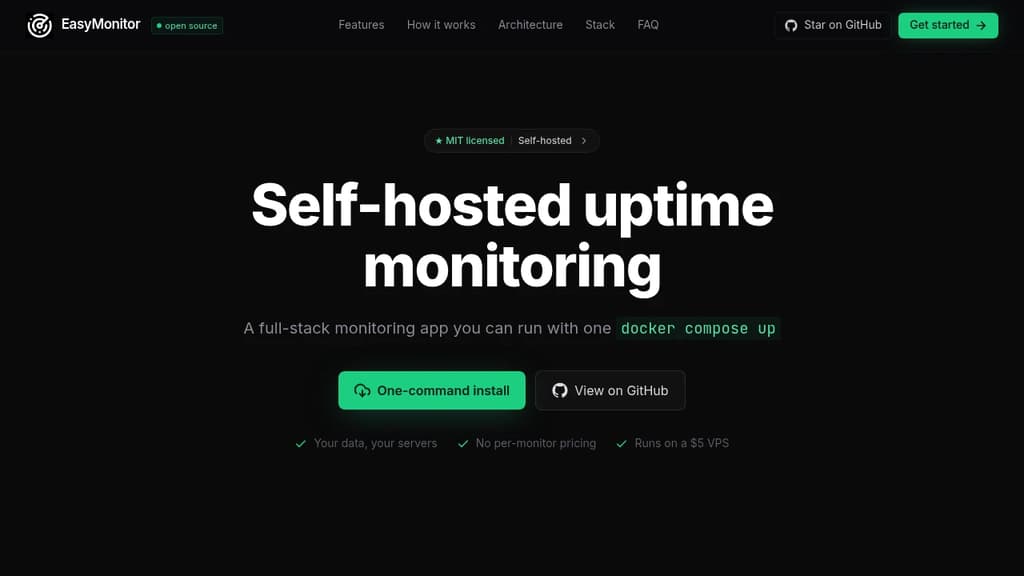
Take control of your monitoring infrastructure with a self-hosted solution that eliminates vendor lock-in and per-monitor pricing. EasyMonitor is a complete uptime monitoring platform you deploy with a single docker compose up command, giving you full ownership of your data and monitoring destiny.
Core capabilities include:
- HTTP and ICMP checks with configurable intervals from 30 seconds to 1 hour
- Multi-region probe deployment via Tailscale, Cloudflare Tunnel, or your own VPN
- Cross-probe quorum to eliminate false positives from flaky single checks
- Public, unlisted, or private status pages with custom domains and auto-HTTPS
- Multi-channel alerts via email and Pushover with per-user and per-monitor control
- Time-series data storage using TimescaleDB for efficient long-term history retention
- Team collaboration with projects, role-based permissions, and shared access controls
Built on proven technology you likely already know: Laravel 12, PostgreSQL 18, Redis Streams, and Go. The architecture uses Redis to queue checks, lightweight Go probes to execute them, and TimescaleDB to store results efficiently. No exotic databases, no proprietary runtimes—just boring, reliable tech that's easy to debug and extend.
Minimal resource requirements mean you can run this on a $5 VPS with 2 GB of RAM. Unlimited monitors, no tier caps, no per-seat add-ons. Deploy remote probes anywhere you own infrastructure to monitor from multiple regions simultaneously. The entire codebase is MIT licensed on GitHub, so you can audit, modify, and redistribute freely.

Hosted uptime monitoring with multi-region checks, eight monitor types, on-call rotations, escalation policies, and public status pages for SaaS teams and agencies.
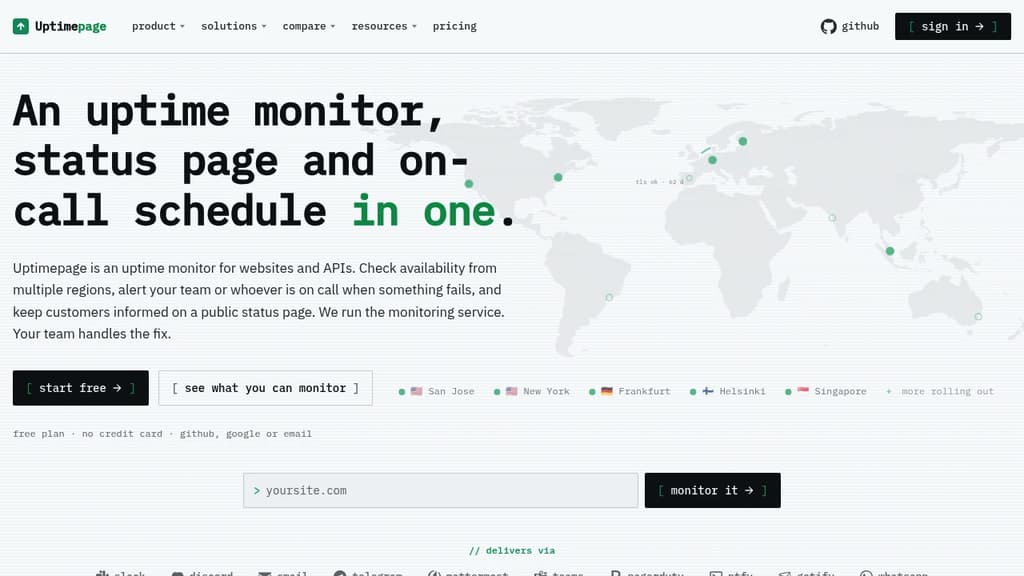
Uptimepage combines uptime monitoring, on-call scheduling, and public status pages in one hosted service. When a check fails, it alerts the right person, tracks the incident, and lets customers follow along on a branded status page. You run the fix; it runs the monitoring stack.
Eight monitor types cover the common failure modes most teams discover the hard way:
- HTTP/HTTPS checks status codes, headers, and body text from every region you pick
- TCP dials a port directly, useful for databases, mail servers, and anything without an HTTP endpoint
- DNS validates that a lookup returns the answer you expect, not just that a resolver responds
- ICMP ping confirms a host is reachable at the network layer
- Heartbeat inverts the model: your cron job calls in, and silence is the alert
- TLS certificate reads the expiry off every handshake and pages you while there's still time to renew
- Domain expiry checks the registry directly so a missed invoice doesn't take the domain down
- Browser login flow runs a real browser through your sign-in steps and charts how long each one takes, catching a broken OAuth secret that a 200 response would hide
Alerts reach Slack, Discord, Teams, PagerDuty, email, SMS, Telegram, WhatsApp, ntfy, Gotify, or any HTTPS webhook. Failure thresholds filter brief interruptions before anything gets paged.
On-call is built in. Schedules rotate people daily, weekly, or on a custom length, with overrides for holidays and swaps, and each person can subscribe to their shifts as a calendar feed. Escalation policies page channels and schedules level by level until someone acknowledges, and a policy can be bound to one monitor or set as the organization default.
Status pages publish live incidents and scheduled maintenance windows with your logo and colors. Customers can review uptime history without signing in. Maintenance windows silence the alert engine so planned work doesn't generate false pages.
For teams managing client work, a shareable monitor link gives a client or vendor a live view of one monitor's uptime, latency, and incidents, with credentials redacted and no access to anything else. Monitors and incidents export as JSON; public incidents are available over RSS. The REST API, Terraform provider, and an MCP server make the whole setup manageable as code.
The source is public under AGPL, so you can verify how it works or self-host if your requirements change. The API and Terraform provider are identical either way. Teams looking at Uptime Kuma, OpenStatus, or Healthchecks will find Uptimepage covers more of the on-call and status-page side without needing a separate tool for each.

Monitor website uptime, detect security vulnerabilities, find broken links, and simulate user flows. Get instant alerts when issues arise. Free tier available.
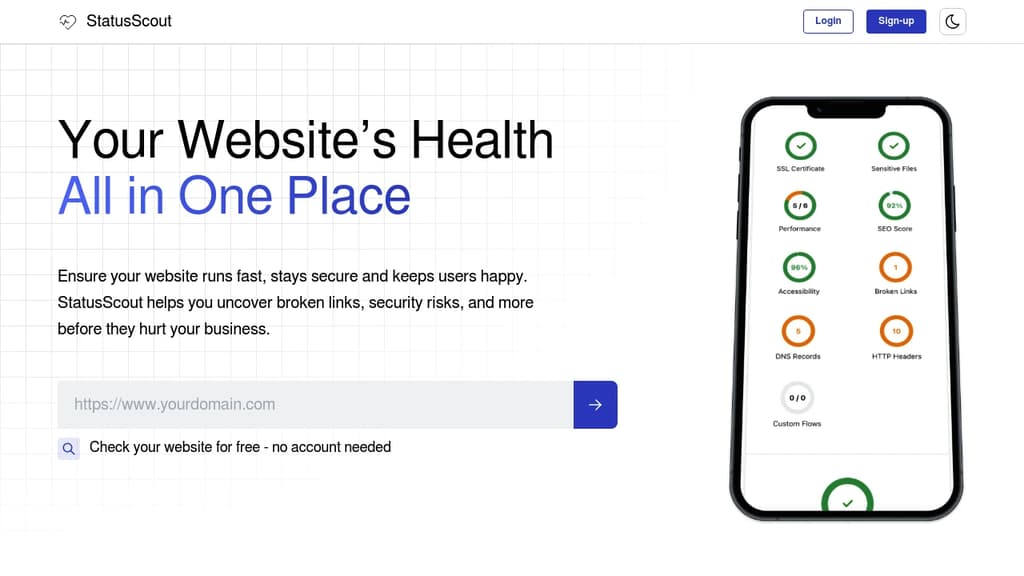
StatusScout provides comprehensive website health monitoring that goes beyond basic uptime checks. This all-in-one platform helps you maintain a secure, fast, and user-friendly website by proactively identifying issues before they impact your visitors.
Key features include:
- Security protection - Detects exposed sensitive files, DNS vulnerabilities, and missing security headers
- Broken link detection - Automatically crawls your site to find and report dead links or bad redirects
- User flow simulation - Tests critical user journeys like signups and checkouts to ensure smooth experiences
- Real-time monitoring - Instant alerts when something breaks, allowing you to resolve issues quickly
- SEO and accessibility insights - Actionable recommendations to improve search rankings and user experience
- Integration verification - Confirms that tracking codes, analytics scripts, and marketing pixels are working properly
Flexible deployment options cater to different needs: a free self-hosted version for complete control, a managed cloud service starting at $12/month for up to 5 websites, and custom enterprise solutions for larger organizations.
The platform is hosted in Europe, runs on renewable energy, and has already delivered insights for over 600 websites. With no credit card required for the cloud tier and a robust roadmap including API access and advanced security scans, StatusScout offers a reliable solution for maintaining website health and performance.

People are looking for alternatives to...
View all alternatives
Spotify

Claude Code

CapCut

Claude

Notion

Lovable
 c15t – Open-source cookie banner, built for control and lightening fast modern web apps.

 Stellar Hosted