Stars
Forks
Last commit
Stars
Forks
Last commit
Stars
Forks
Last commit
Stars
Forks
Last commit
Stars
Forks
Last commit
Stars
Forks
Last commit
Stars
Forks
Last commit
Stars
Forks
Last commit
Stars
Forks
Last commit
Stars
Forks
Last commit
Stars
Forks
Last commit
Stars
Forks
Last commit
The best open source alternative to Paessler PRTG is Grafana. If that doesn't suit you, we've compiled a ranked list of other open source Paessler PRTG alternatives to help you find a suitable replacement. Other interesting open source alternatives to Paessler PRTG are: NetData, OpenObserve, Checkmk, and Icinga.
Paessler PRTG alternatives are mainly Infrastructure Monitoring Tools but may also be Performance Monitoring (APM) Tools or Data Visualization Tools. Browse these if you want a narrower list of alternatives or looking for a specific functionality of Paessler PRTG.
Grafana is a multi-platform open source analytics and interactive visualization web application that provides charts, graphs, and alerts for the web.

Grafana is a powerful and versatile open-source platform for data visualization and monitoring. It allows users to query, visualize, alert on, and understand metrics no matter where they are stored. Key features include:
Support for multiple data sources: Grafana can connect to various databases and time series data stores, including Prometheus, InfluxDB, Elasticsearch, and many more.
Customizable dashboards: Users can create rich, interactive dashboards with a wide range of visualization options, from simple line graphs to complex heatmaps.
Alerting system: Grafana includes a flexible alerting engine that can notify users when specific conditions are met in their data.
Plugin ecosystem: Extend Grafana's functionality with a wide range of community-contributed and official plugins.
User management and authentication: Grafana offers built-in user authentication and supports various external authentication providers.
Templating and variables: Create dynamic dashboards that adapt to different contexts and data sets.
Grafana is widely used in various industries for monitoring infrastructure, applications, and business metrics. It's known for its flexibility, ease of use, and ability to bring together data from multiple sources into a single, cohesive view.
Powerful, efficient, and user-friendly monitoring solution for servers, containers, and applications with instant insights and alerts.
NetData is a cutting-edge, open-source monitoring and troubleshooting tool designed for modern infrastructure and applications. It offers real-time, high-resolution metrics collection and visualization, enabling users to gain instant insights into their systems' performance.
Key benefits of NetData include:
NetData empowers DevOps teams, system administrators, and developers to identify and resolve performance bottlenecks quickly. Its user-friendly interface and powerful analytics capabilities make it an essential tool for maintaining optimal system health and performance in today's fast-paced, data-driven environments.
Monitor logs, metrics, and traces with an open-source observability platform. Achieve petabyte scale with 140x lower storage costs and high performance.
OpenObserve is a comprehensive, open-source observability platform designed for logs, metrics, and traces. It offers a modern, scalable architecture built for high performance and significant cost savings. The platform's primary advantage is its efficiency, providing up to 140x lower storage costs when compared to alternatives like Elasticsearch. This is achieved through high data compression and a columnar storage format.
Key features include:
Monitor your entire IT infrastructure with 2,000+ plugins, automated discovery, and scalable architecture. Open source and enterprise solutions available.
Comprehensive IT monitoring that scales from small teams to enterprise environments with millions of services. Checkmk automatically discovers and monitors your entire infrastructure - from cloud providers to data centers, servers, networks, containers, and applications.
Key advantages include:
Multiple deployment options cater to different needs:
Advanced features include dynamic dashboards, business intelligence mapping, custom self-healing actions, and comprehensive SLA reporting. The platform combines infrastructure monitoring with log analysis, synthetic testing capabilities, and historical performance forecasting to provide complete visibility into your IT operations.
Monitor networks, servers, and cloud environments with flexible open-source solution. Custom checks, fast alerts, and complete infrastructure control.
Complete visibility across your entire IT landscape with this comprehensive open-source monitoring platform. Whether managing on-premises servers, cloud environments, or hybrid infrastructures, you get the flexibility and control needed for complex enterprise monitoring.
Key capabilities include:
Comprehensive monitoring solutions cover Kubernetes clusters, database performance, Windows and VMware environments, plus business-critical applications. The platform bridges monitoring with IT service workflows and security operations for unified visibility.
Enterprise-ready features include automation capabilities, API-driven processes, extensive integrations with existing DevOps tools, and professional support options. Built on open-source principles while delivering enterprise-grade stability, security, and customization options that adapt to your operational needs.
Free open source IT monitoring solution for servers, networks, and applications. Trusted by 1M+ users worldwide with powerful alerting and enterprise-grade features.
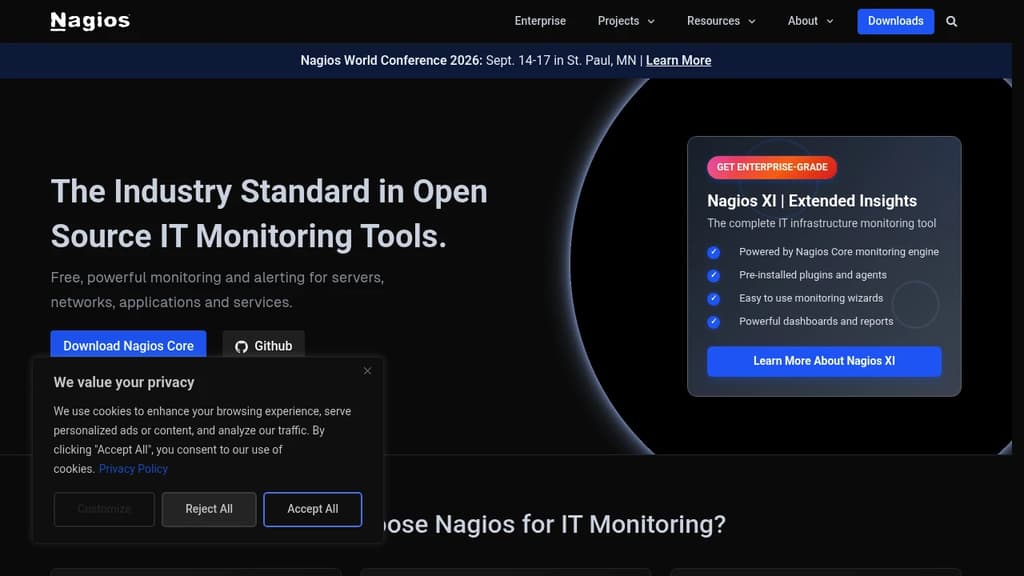
Nagios is the industry-standard open source monitoring solution that has been protecting critical IT infrastructure for over 25 years. Trusted by more than 1 million users worldwide, this powerful platform provides comprehensive monitoring and alerting for servers, networks, applications, and services.
The platform offers complete infrastructure monitoring capabilities, supporting Windows, Linux systems, and network devices to prevent downtime before it impacts business operations. With its powerful plugin architecture, users can extend functionality through thousands of community-developed plugins, including NRPE, NSCA, and custom monitoring solutions.
Key benefits include:
The Nagios Core Services Platform provides everything needed in one comprehensive package, including the monitoring engine, 50+ official plugins, cross-platform agents, and configuration tools. Whether you're monitoring simple setups or complex enterprise infrastructure, Nagios delivers the flexibility and reliability needed to maintain optimal system performance.

The purpose-built time series platform for high-velocity ingestion and real-time queries at scale, without sacrificing performance or cost. Download InfluxDB for free.
Try for free Sent
Sent