Open Source Highlight Alternatives
A curated collection of the 6 best open source alternatives to Highlight.
The best open source alternative to Highlight is Sentry. If that doesn't suit you, we've compiled a ranked list of other open source Highlight alternatives to help you find a suitable replacement. Other interesting open source alternatives to Highlight are: HyperDX, Uptrace, Maple, and Bugsink.
Highlight alternatives are mainly Performance Monitoring (APM) Tools but may also be Error Tracking Tools or Log Management Tools. Browse these if you want a narrower list of alternatives or looking for a specific functionality of Highlight.

Written by Piotr Kulpinski


Detect, diagnose, and resolve software issues quickly with powerful error tracking, performance monitoring, and release management.
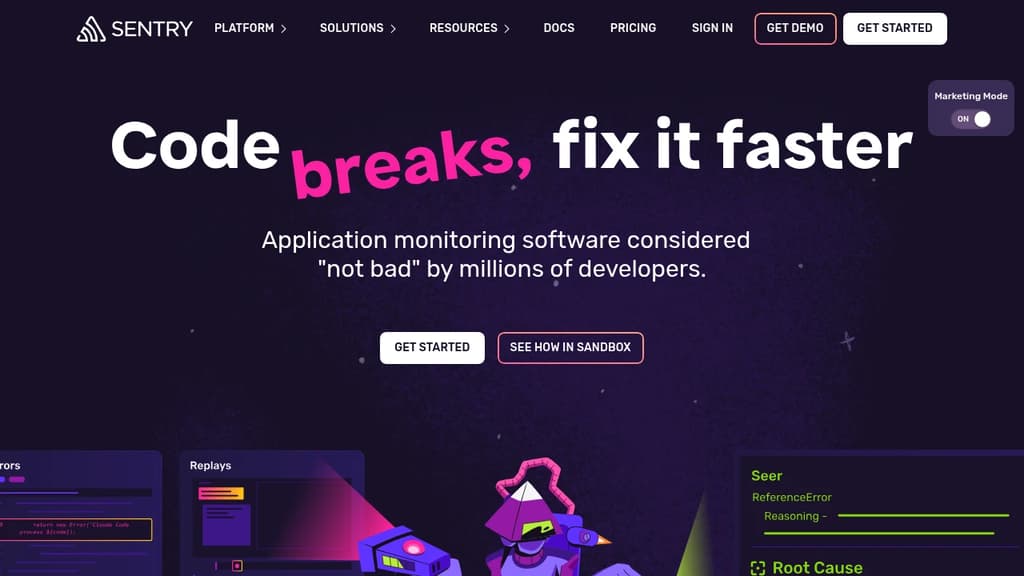
Sentry is a powerful developer-first application monitoring platform that helps teams identify, triage, and resolve software errors and performance issues in real-time. With its comprehensive suite of tools, Sentry enables developers to:
- Catch and diagnose errors instantly: Receive detailed error reports with stack traces, user context, and environment information to quickly pinpoint and fix issues.
- Monitor application performance: Track key metrics, identify bottlenecks, and optimize your code with performance monitoring and profiling tools.
- Streamline release management: Correlate errors with specific releases, track adoption rates, and manage version rollouts effectively.
- Integrate seamlessly: Connect Sentry with your existing workflow using integrations for popular development tools and platforms.
- Customize and scale: Tailor Sentry to your needs with flexible data management, custom alerting, and support for multiple programming languages and frameworks.
By providing real-time visibility into your application's health, Sentry helps teams reduce downtime, improve user experience, and ship better code faster. Whether you're working on web, mobile, or desktop applications, Sentry's robust features and intuitive interface make it an essential tool for modern software development and operations.

Open source observability platform unifying session replays, logs, traces, metrics and errors. Fast search, automatic clustering, $0.40/GB pricing.
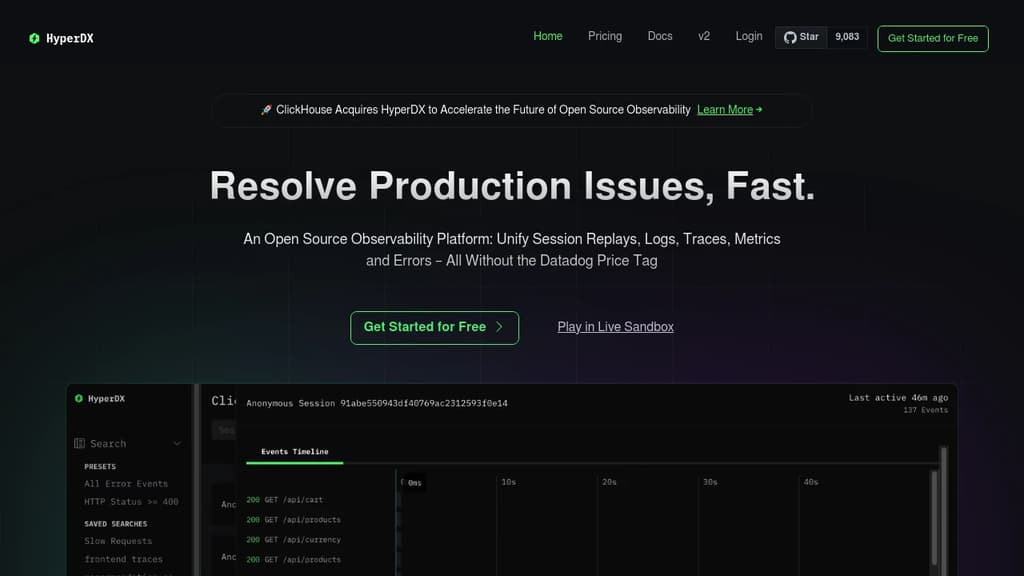
Open source observability platform that unifies session replays, logs, traces, metrics and errors into a single view - all without the expensive Datadog price tag. Recently acquired by ClickHouse to accelerate open source observability innovation.
Key capabilities include:
- End-to-end correlation - Trace requests from user browsers to backend servers and async workers automatically
- Blazing fast search - Query terabytes of events in seconds, powered by ClickHouse
- Automatic clustering - Condense billions of events into distinctive patterns without manual configuration
- Session replay integration - Automatically link user sessions with backend logs and traces
- Intuitive visualization - Build charts and graphs with simple full-text search, no complex syntax required
Developer-friendly features:
- OpenTelemetry-powered instrumentation prevents vendor lock-in
- Agent-free installation option eliminates infrastructure overhead
- Native JSON parsing for structured logs with zero configuration
- Real-time live tail for immediate log stream monitoring
- Intercom integration for jumping directly from support tickets to user sessions
Transparent pricing at $0.40 per GB with no per-user or per-host fees makes enterprise-grade observability accessible to teams of all sizes. Trusted by high-velocity engineering teams for resolving production issues fast.

Uptrace is an OpenTelemetry-based platform that integrates traces, metrics, and logs to help monitor and optimize complex distributed systems.
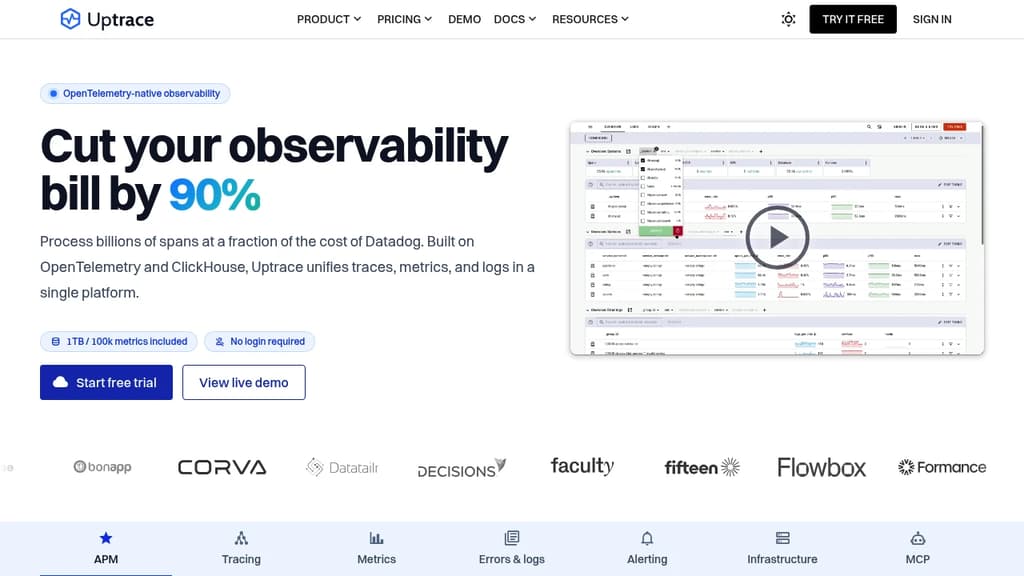
Uptrace is an open-source observability platform built on OpenTelemetry, designed to help developers and operations teams monitor, understand, and optimize complex distributed systems. It offers a comprehensive solution for application performance monitoring (APM) with integrated tracing, metrics, and logging capabilities.
Key features and benefits:
-
All-in-one solution:
- Integrates traces, metrics, and logs in a single platform
- Eliminates the need for multiple monitoring tools
- Supports data from OpenTelemetry, Prometheus, Vector, FluentBit, and CloudWatch
-
Flexible deployment options:
- Self-hosted: Free to use without limitations
- Managed cloud service: For those who prefer a hands-off approach
- On-premise installation available upon request
-
Cost-effective and predictable pricing:
- Pay only for ingested gigabytes and active timeseries
- Set a budget to avoid unexpected costs
- First month free with 1TB storage and 50,000 timeseries (no credit card required)
-
OpenTelemetry integration:
- Quick setup with minimal code changes
- Supports multiple programming languages (Go, Python, Ruby, Node.js, .NET, Java, Erlang, Elixir, Rust, PHP)
- Vendor-agnostic instrumentation for easy switching between providers
-
Comprehensive monitoring dashboard:
- Service graph showing relationships between components
- RED metrics (Rate, Errors, Duration)
- Latency percentiles (p50/p90/p99/max)
- Most frequent logs and errors
- Slowest requests identification
-
Scalability:
- Designed to work at any scale, from small applications to large distributed systems
-
Incident response:
- Helps teams identify and resolve issues quickly, often before customers notice
By offering a unified platform for observability, Uptrace simplifies the monitoring process and provides valuable insights into application performance, helping teams optimize their systems and respond to incidents more effectively.

Observability platform built on OpenTelemetry and ClickHouse. Collect, visualize, and query distributed traces, logs, and metrics, with an MCP server for AI agent diagnostics.
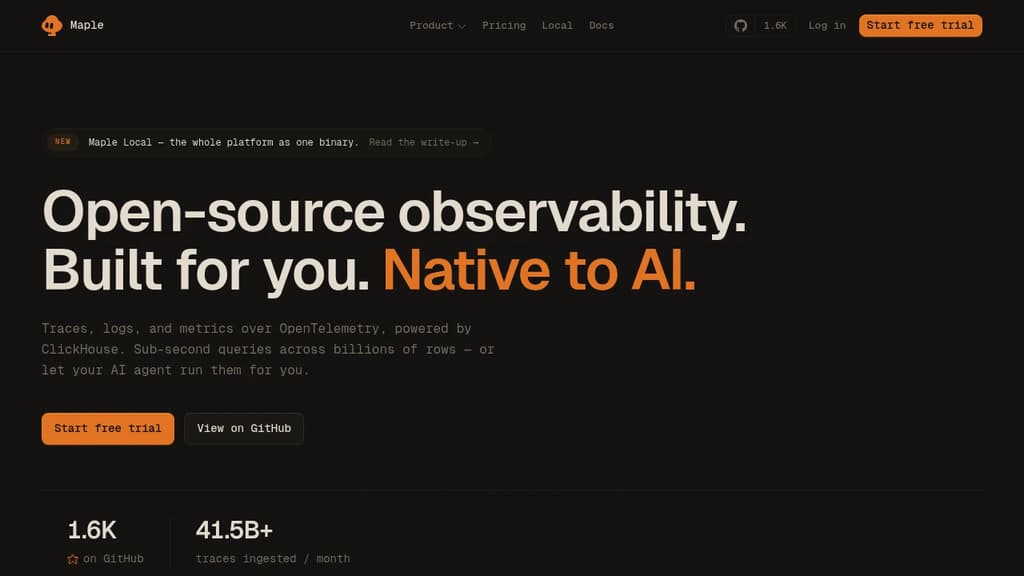
Maple is an observability platform for distributed systems, built on OpenTelemetry and backed by ClickHouse for sub-second queries across billions of rows. It handles traces, logs, and metrics in one place, with correlated data across all three signals tied to a single trace ID. No stitching between tools, no second search in a second product.
The incident workflow is its sharpest edge. An alert arrives carrying the service, the broken threshold, and sample traces. From there you open the failing span tree, jump to correlated logs on the same trace ID, and see exactly what happened. Retry exhaustion, a full connection pool, three Stripe timeouts at 1.75 seconds each – all visible without switching tabs.
Key capabilities:
- Distributed tracing – full span trees with every attribute intact, no sampling gap hiding the outlier
- Structured logs – OTLP logs searchable by severity, service, message, and duration in seconds
- Session replay – browser clicks, routes, console lines, and failed requests, joined to spans by session ID
- Metrics and dashboards – request rate, error rate, latency percentiles, drag-to-build or agent-suggested
- Service maps – live request flow across services, the dependency cascade you'd otherwise reconstruct after the fact
- Error tracking – errors grouped by type, with trends, affected services, and sample traces attached
- Alerting – seven signal types with severity, incident tracking, and auto-resolution; routes to Slack, Discord, PagerDuty, or any webhook
- MCP server – any compatible AI agent (Claude, Cursor, others) can list services, search traces, read source files, and open a PR with a proposed fix
- Kubernetes integration – Helm chart that joins spans to pod, node, and namespace; kube-state metrics included
Compared to tools like HyperDX or Uptrace, Maple's first-class MCP surface is a genuine differentiator. The agent doesn't just read dashboards – it pulls the source file behind a failing span, so the fix it proposes cites your actual code. It can also write back: claim an issue, set severity, attach a fix.
The local mode runs as a single compiled binary with an embedded ClickHouse, OTLP ingest, query API, and dashboard – all on localhost, no account required. For production, you can self-host against your own ClickHouse or use the hosted plan at $39/month for 100 GB per signal, then $0.30/GB flat. No per-host fees. No per-seat fees.
The source is on GitHub under FSL-1.1, which converts to Apache 2.0 two years after each release. OpenTelemetry in means no proprietary agent and no re-instrumentation if you switch.

Bugsink offers real-time error tracking with self-hosting capabilities, allowing easy installation and connection to any app using Sentry-compatible SDKs.
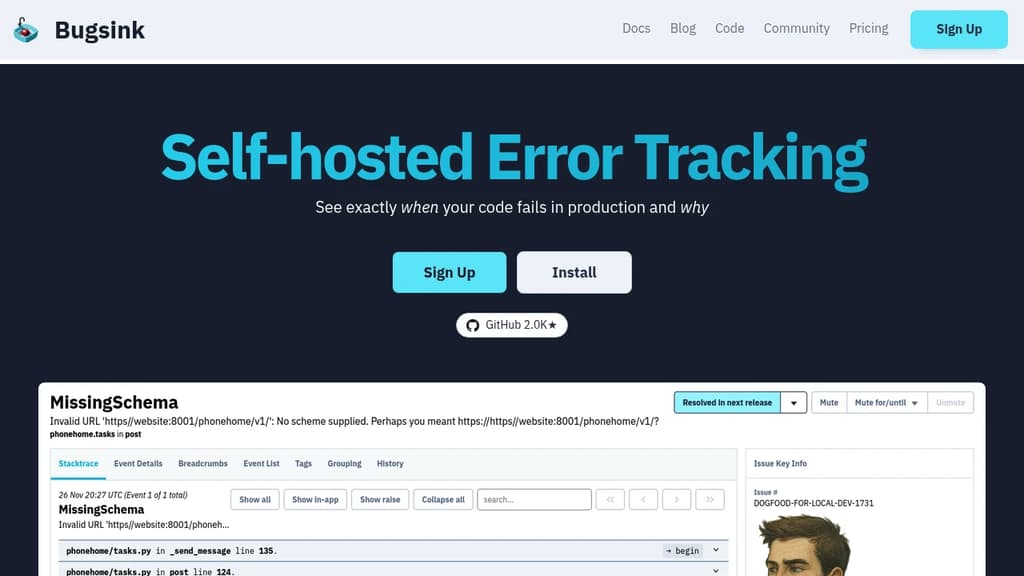
Bugsink is a powerful self-hosted error tracking solution designed for developers who want full control over their error monitoring infrastructure. With Bugsink, you can easily install the platform on your own servers and connect any application using Sentry-compatible SDKs.
Key features of Bugsink include:
- Self-hosted control: Install Bugsink on your own servers for complete data ownership and privacy.
- Real-time error tracking: Get instant notifications about errors in your applications as they occur.
- Sentry SDK compatibility: Seamlessly integrate with most popular programming languages using existing Sentry SDKs.
- Scalable performance: Handle millions of events daily without failure, ensuring reliability when you need it most.
- Comprehensive error details: Access all the information needed to triage and fix errors in one centralized location.
- Easy installation: Follow detailed instructions to get up and running quickly.
Bugsink empowers development teams to maintain high-quality applications by providing a robust, scalable, and self-controlled error tracking solution. Whether you're managing a small project or a large-scale application, Bugsink offers the tools you need to identify, analyze, and resolve issues efficiently.

Self-hostable error tracking platform compatible with Sentry SDKs. Tracks exceptions, monitors performance, checks uptime, and collects logs without the Sentry price tag.
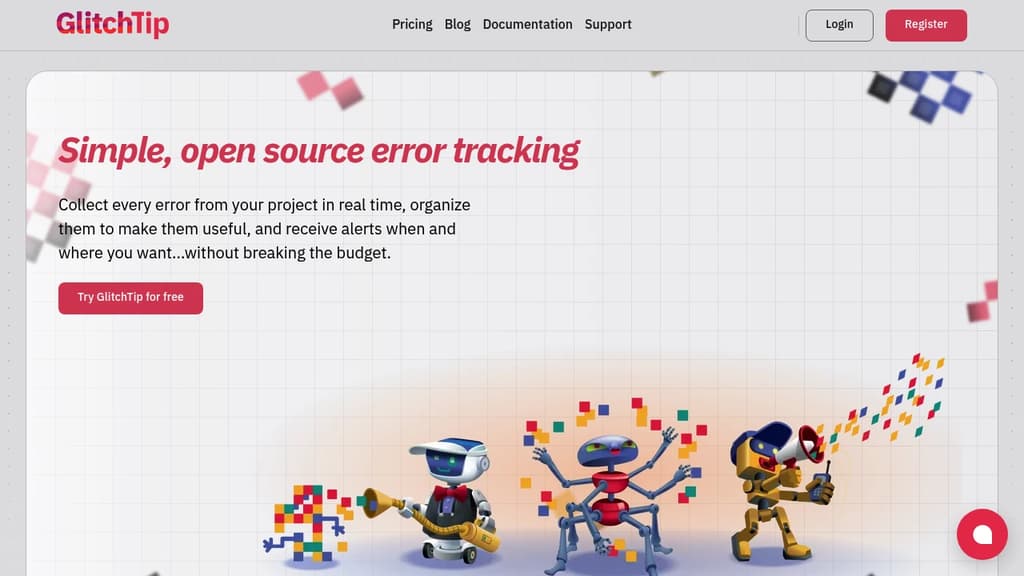
GlitchTip is an open source error tracking platform built for teams who want the functionality of Sentry without the cost or the vendor lock-in. It's compatible with Sentry's client SDKs, so you can point your existing instrumentation at GlitchTip without rewriting anything.
The focus is on simplicity. There's no dashboard-building ritual or metric-hunting before you can find what's wrong. You get organized errors, slow transaction data, and uptime status in one place, ready to act on.
What GlitchTip covers:
- Error tracking: Collects exceptions, log messages, and Content Security Policy violations from your app in real time. Triage and resolve issues from a single inbox.
- Performance monitoring: Surfaces your slowest web requests, database calls, and transactions without requiring manual dashboard setup.
- Uptime monitoring: Pings your site on a schedule and alerts you when it goes down. Also supports the reverse: send GlitchTip a heartbeat ping, and it alerts you if the ping stops arriving. Similar to what Healthchecks does for cron jobs.
- Logs: Search and filter application logs alongside errors and performance data, keeping context together during debugging.
Alerts go out via email or webhook, and you control when and how they fire.
You can self-host GlitchTip on your own infrastructure or use the hosted version at app.glitchtip.com. The hosted tier starts free for personal projects (up to 1,000 events per month) and scales to paid plans for larger teams. Self-hosting has no event caps imposed by the platform itself.
It's a practical fit for small teams and solo developers who find Bugsnag or Sentry too expensive, and for organizations that need to keep error data on their own servers for compliance or privacy reasons.

People are looking for alternatives to...
View all alternatives
Spotify

Claude Code

CapCut

Claude

Notion

Lovable
 Openlane – Open-source, developer-first platform for automated compliance, risk management, and built-in Trust Center.

 Openlane