Open Source Gigapipe Alternatives
A curated collection of the 9 best open source alternatives to Gigapipe.
The best open source alternative to Gigapipe is ProjectDiscovery. If that doesn't suit you, we've compiled a ranked list of other open source Gigapipe alternatives to help you find a suitable replacement. Other interesting open source alternatives to Gigapipe are: SigNoz, OpenObserve, Logstash, and HyperDX.
Gigapipe alternatives are mainly Log Management Tools but may also be Infrastructure Monitoring Tools or Performance Monitoring (APM) Tools. Browse these if you want a narrower list of alternatives or looking for a specific functionality of Gigapipe.
Written by Piotr Kulpinski


Monitor infrastructure for exploitable vulnerabilities with real-time detection, automated workflows, and zero false positives.
ProjectDiscovery delivers enterprise-grade vulnerability management with a focus on detecting only exploitable vulnerabilities to eliminate false positives. The platform features real-time infrastructure monitoring that provides instant visibility into your entire tech stack as teams deploy.
Key capabilities include:
- Zero-noise vulnerability detection that identifies only actual exploitable vulnerabilities
- Comprehensive asset discovery to map and contextualize your complete attack surface
- Custom exploit detection through the open-source Nuclei framework
- Automated workflows for instant organization-wide detection and triage
- Multi-protocol support covering web, network, DNS, and cloud infrastructure
The platform is trusted by over 100,000 security professionals to transform noisy scan results into relevant, actionable alerts that enable 10x faster vulnerability triage and remediation.
Looking for open source alternatives to other popular services? Check out other posts in the alternatives series and openalternative.co, a directory of open source software with filters for tags and alternatives for easy browsing and discovery.

Comprehensive monitoring and troubleshooting solution for microservices architectures, offering metrics, traces, and logs in a single pane.
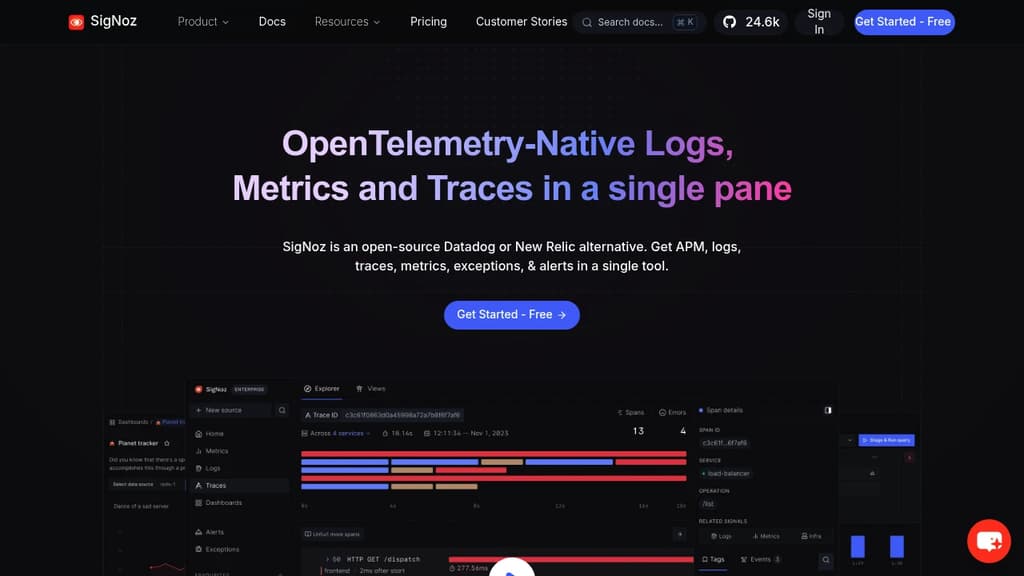
SigNoz is a powerful, open-source observability platform designed for modern, cloud-native applications. It provides a unified solution for monitoring, troubleshooting, and optimizing your microservices architecture.
Key benefits of SigNoz include:
-
All-in-One Observability: Combine metrics, traces, and logs in a single platform, eliminating the need for multiple tools and reducing context-switching.
-
Cost-Effective: As an open-source solution, SigNoz offers significant cost savings compared to proprietary alternatives, especially for high-volume data ingestion.
-
Easy Setup: Get started quickly with a simple installation process and intuitive UI, making it accessible for teams of all sizes.
-
Customizable Dashboards: Create tailored views of your system's performance with flexible, drag-and-drop dashboard builders.
-
Distributed Tracing: Gain deep insights into request flows across your microservices, helping you identify bottlenecks and optimize performance.
-
Anomaly Detection: Leverage built-in anomaly detection capabilities to proactively identify issues before they impact your users.
-
Scalability: Designed to handle high-volume data ingestion, SigNoz scales effortlessly with your growing infrastructure.
-
Open Standards: Built on OpenTelemetry, ensuring compatibility with a wide range of technologies and future-proofing your observability stack.
By choosing SigNoz, you're not just adopting a monitoring tool; you're embracing a comprehensive observability solution that grows with your needs and empowers your team to maintain high-performing, reliable applications.

Monitor logs, metrics, and traces with an open-source observability platform. Achieve petabyte scale with 140x lower storage costs and high performance.
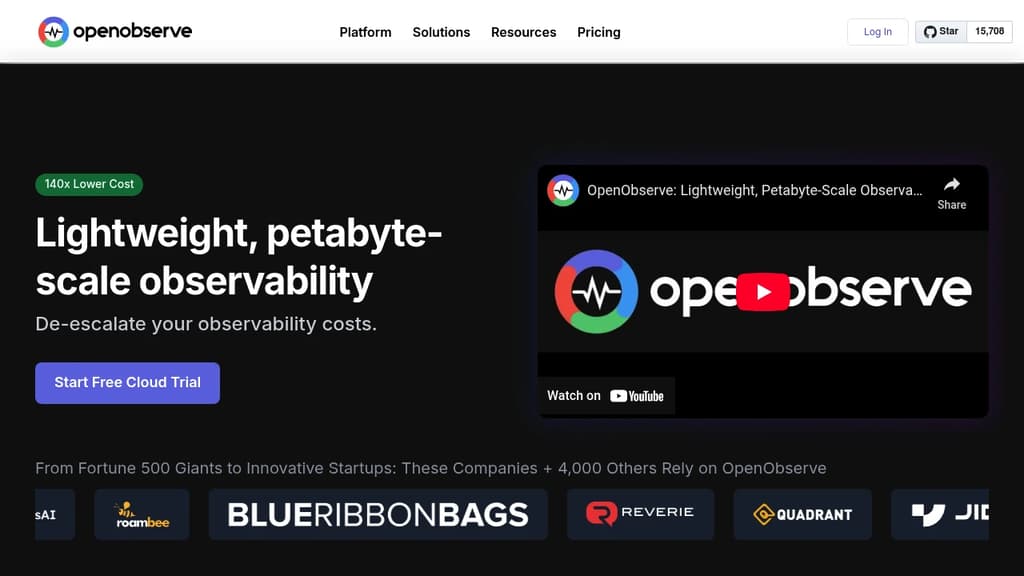
OpenObserve is a comprehensive, open-source observability platform designed for logs, metrics, and traces. It offers a modern, scalable architecture built for high performance and significant cost savings. The platform's primary advantage is its efficiency, providing up to 140x lower storage costs when compared to alternatives like Elasticsearch. This is achieved through high data compression and a columnar storage format.
Key features include:
- High Performance: Built in Rust and utilizing the DataFusion query engine for rapid data analysis, even at petabyte scale.
- Scalability: A stateless architecture allows for easy horizontal scaling to handle enterprise-level workloads.
- Cost-Effectiveness: Drastically reduces telemetry costs with high compression and the ability to use your own storage buckets like S3, GCS, and Azure Blob.
- Open Standards: Fully compatible with OpenTelemetry, ensuring seamless integration with existing tools and workflows.

Logstash is a free and open server-side data processing pipeline that ingests data from multiple sources, transforms it, and sends it to your desired destination.

Logstash is a powerful data processing pipeline that allows you to collect, transform, and ship data from various sources to multiple destinations. Here are some key features and benefits:
-
Versatile Input Support:
- Ingest data from a wide range of sources, including logs, metrics, web applications, data stores, and AWS services.
- Supports continuous, streaming data ingestion.
-
Powerful Data Transformation:
- Parse and structure unstructured data using grok patterns.
- Derive additional information, such as geolocations from IP addresses.
- Anonymize or exclude sensitive data for compliance and security.
- Transform data into a common format for easier analysis.
-
Flexible Output Options:
- Send processed data to various destinations, with Elasticsearch being a primary output.
- Route data to multiple outputs simultaneously for different use cases.
-
Extensibility:
- Pluggable framework with over 200 plugins available.
- Easy-to-build custom plugins for specific needs.
-
Reliability and Security:
- Guarantees at-least-once delivery with persistent queues.
- Dead letter queues for handling processing failures.
- Ability to secure ingest pipelines.
-
Monitoring and Management:
- Built-in monitoring features for observing performance and availability.
- Pipeline Viewer for understanding and optimizing data flows.
- Centralized management through a user-friendly UI.
-
Elastic Stack Integration:
- Seamless integration with other Elastic Stack components like Elasticsearch and Kibana.
- Pre-built modules for quick setup with popular data sources.
Logstash is an essential tool for organizations looking to centralize and process their data efficiently, making it ready for analysis and visualization in platforms like Elasticsearch and Kibana.

Open source observability platform unifying session replays, logs, traces, metrics and errors. Fast search, automatic clustering, $0.40/GB pricing.

Open source observability platform that unifies session replays, logs, traces, metrics and errors into a single view - all without the expensive Datadog price tag. Recently acquired by ClickHouse to accelerate open source observability innovation.
Key capabilities include:
- End-to-end correlation - Trace requests from user browsers to backend servers and async workers automatically
- Blazing fast search - Query terabytes of events in seconds, powered by ClickHouse
- Automatic clustering - Condense billions of events into distinctive patterns without manual configuration
- Session replay integration - Automatically link user sessions with backend logs and traces
- Intuitive visualization - Build charts and graphs with simple full-text search, no complex syntax required
Developer-friendly features:
- OpenTelemetry-powered instrumentation prevents vendor lock-in
- Agent-free installation option eliminates infrastructure overhead
- Native JSON parsing for structured logs with zero configuration
- Real-time live tail for immediate log stream monitoring
- Intercom integration for jumping directly from support tickets to user sessions
Transparent pricing at $0.40 per GB with no per-user or per-host fees makes enterprise-grade observability accessible to teams of all sizes. Trusted by high-velocity engineering teams for resolving production issues fast.

Open-source platform for logging, monitoring, and debugging LLM applications. Route, debug, and analyze AI apps with comprehensive observability tools.

Helicone is the open-source platform that helps developers build reliable AI applications through comprehensive observability. Trusted by the world's fastest-growing AI companies, it provides essential tools for routing, debugging, and analyzing LLM applications.
Key Features:
- Universal Integration: Access 100+ models with a single integration (beta)
- Complete Observability: Log, monitor, and debug your AI applications
- Advanced Analytics: Track requests, segments, sessions, and user properties
- Developer Tools: Prompts playground, experiments, evaluators, and datasets
- Enterprise Ready: Scalable solution for growing AI companies
The platform offers a comprehensive dashboard for monitoring AI application performance, with detailed request tracking and user analytics. Developers can experiment with prompts, run evaluations, and manage datasets all within one unified interface.
Getting Started: No credit card required with a 7-day free trial. The platform is designed to help developers quickly identify issues, optimize performance, and ensure their AI applications run reliably at scale.
Looking for open source alternatives to other popular services? Check out other posts in the alternatives series and openalternative.co, a directory of open source software with filters for tags and alternatives for easy browsing and discovery.

Logfire offers intuitive observability tools for Python applications, combining logs, profiling, and telemetry in one platform.
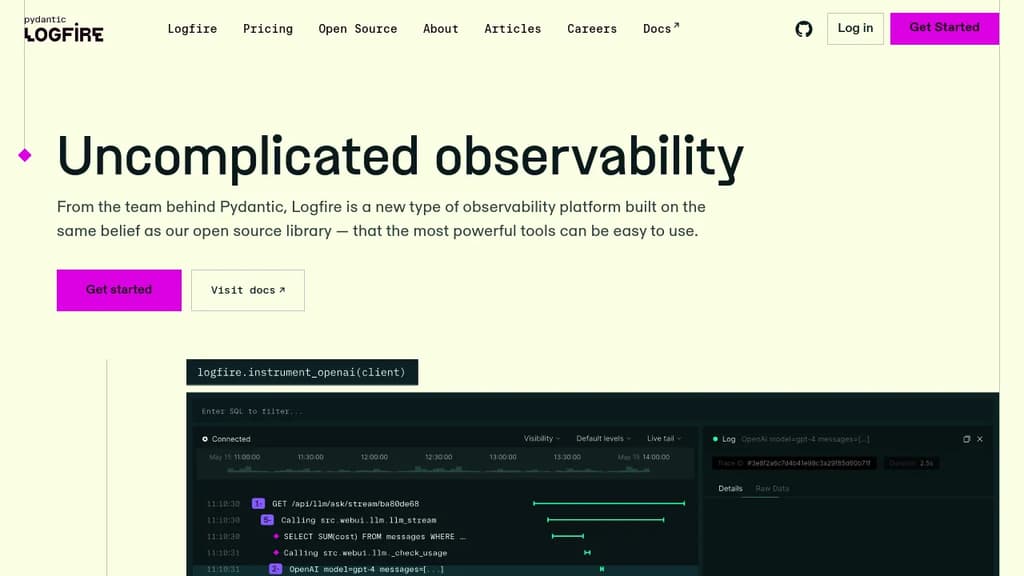
Logfire brings powerful observability to Python applications with remarkable simplicity. Built by the team behind Pydantic, it offers developers an intuitive way to gain deep insights into their code.
Key features:
- Seamless integration: Easy setup with popular Python libraries and frameworks
- Comprehensive visibility: Monitor logs, traces, and performance metrics in one place
- Structured data: Query-ready logs for easy analysis and visualization
- Manual tracing: Create custom logs and traces with a modern, user-friendly interface
- OpenTelemetry support: Leverage the power of OTel with simplified implementation
Logfire transforms complex observability tasks into actionable insights. Whether you're building AI tools or cloud-based applications, it provides a clear window into your code's behavior. With features like performance profiling and full execution tracing, Logfire helps developers quickly identify and resolve issues.
The platform's intuitive design makes it accessible for teams of all sizes, eliminating the need for dedicated observability experts. By combining ease of use with powerful analytics capabilities, Logfire empowers developers to make data-driven decisions and continuously improve their applications.

Uptrace is an OpenTelemetry-based platform that integrates traces, metrics, and logs to help monitor and optimize complex distributed systems.

Uptrace is an open-source observability platform built on OpenTelemetry, designed to help developers and operations teams monitor, understand, and optimize complex distributed systems. It offers a comprehensive solution for application performance monitoring (APM) with integrated tracing, metrics, and logging capabilities.
Key features and benefits:
-
All-in-one solution:
- Integrates traces, metrics, and logs in a single platform
- Eliminates the need for multiple monitoring tools
- Supports data from OpenTelemetry, Prometheus, Vector, FluentBit, and CloudWatch
-
Flexible deployment options:
- Self-hosted: Free to use without limitations
- Managed cloud service: For those who prefer a hands-off approach
- On-premise installation available upon request
-
Cost-effective and predictable pricing:
- Pay only for ingested gigabytes and active timeseries
- Set a budget to avoid unexpected costs
- First month free with 1TB storage and 50,000 timeseries (no credit card required)
-
OpenTelemetry integration:
- Quick setup with minimal code changes
- Supports multiple programming languages (Go, Python, Ruby, Node.js, .NET, Java, Erlang, Elixir, Rust, PHP)
- Vendor-agnostic instrumentation for easy switching between providers
-
Comprehensive monitoring dashboard:
- Service graph showing relationships between components
- RED metrics (Rate, Errors, Duration)
- Latency percentiles (p50/p90/p99/max)
- Most frequent logs and errors
- Slowest requests identification
-
Scalability:
- Designed to work at any scale, from small applications to large distributed systems
-
Incident response:
- Helps teams identify and resolve issues quickly, often before customers notice
By offering a unified platform for observability, Uptrace simplifies the monitoring process and provides valuable insights into application performance, helping teams optimize their systems and respond to incidents more effectively.
Monitor your entire IT infrastructure with 2,000+ plugins, automated discovery, and scalable architecture. Open source and enterprise solutions available.

Comprehensive IT monitoring that scales from small teams to enterprise environments with millions of services. Checkmk automatically discovers and monitors your entire infrastructure - from cloud providers to data centers, servers, networks, containers, and applications.
Key advantages include:
- 2,000+ vendor-maintained plugins for out-of-the-box monitoring of virtually any system
- Automated discovery and configuration via REST API reduces manual setup time
- High-performance core designed to handle massive scale while maintaining a small footprint
- Granular alerting system that notifies only relevant teams and integrates with ServiceNow, Jira, Slack, and more
Multiple deployment options cater to different needs:
- Raw Edition: Free open-source version for mid-sized infrastructures
- Enterprise Edition: Advanced automation and visualization features
- Cloud Edition: SaaS solution optimized for hybrid cloud environments
- MSP Edition: Multi-tenant capabilities for service providers
Advanced features include dynamic dashboards, business intelligence mapping, custom self-healing actions, and comprehensive SLA reporting. The platform combines infrastructure monitoring with log analysis, synthetic testing capabilities, and historical performance forecasting to provide complete visibility into your IT operations.
 Logto
LogtoPeople are looking for alternatives to...