Stars
Forks
Last commit
Stars
Forks
Last commit
Stars
Forks
Last commit
Stars
Forks
Last commit
Stars
Forks
Last commit
Stars
Forks
Last commit
Stars
Forks
Last commit
Stars
Forks
Last commit
Stars
Forks
Last commit
Stars
Forks
Last commit
Stars
Forks
Last commit
Stars
Forks
Last commit
The best open source alternative to Checkmk is Grafana. If that doesn't suit you, we've compiled a ranked list of other open source Checkmk alternatives to help you find a suitable replacement. Other interesting open source alternatives to Checkmk are: NetData, SigNoz, ProjectDiscovery, and Uptrace.
Checkmk alternatives are mainly Infrastructure Monitoring Tools but may also be Performance Monitoring (APM) Tools or Data Visualization Tools. Browse these if you want a narrower list of alternatives or looking for a specific functionality of Checkmk.
Grafana is a multi-platform open source analytics and interactive visualization web application that provides charts, graphs, and alerts for the web.

Grafana is a powerful and versatile open-source platform for data visualization and monitoring. It allows users to query, visualize, alert on, and understand metrics no matter where they are stored. Key features include:
Support for multiple data sources: Grafana can connect to various databases and time series data stores, including Prometheus, InfluxDB, Elasticsearch, and many more.
Customizable dashboards: Users can create rich, interactive dashboards with a wide range of visualization options, from simple line graphs to complex heatmaps.
Alerting system: Grafana includes a flexible alerting engine that can notify users when specific conditions are met in their data.
Plugin ecosystem: Extend Grafana's functionality with a wide range of community-contributed and official plugins.
User management and authentication: Grafana offers built-in user authentication and supports various external authentication providers.
Templating and variables: Create dynamic dashboards that adapt to different contexts and data sets.
Grafana is widely used in various industries for monitoring infrastructure, applications, and business metrics. It's known for its flexibility, ease of use, and ability to bring together data from multiple sources into a single, cohesive view.
Powerful, efficient, and user-friendly monitoring solution for servers, containers, and applications with instant insights and alerts.
NetData is a cutting-edge, open-source monitoring and troubleshooting tool designed for modern infrastructure and applications. It offers real-time, high-resolution metrics collection and visualization, enabling users to gain instant insights into their systems' performance.
Key benefits of NetData include:
NetData empowers DevOps teams, system administrators, and developers to identify and resolve performance bottlenecks quickly. Its user-friendly interface and powerful analytics capabilities make it an essential tool for maintaining optimal system health and performance in today's fast-paced, data-driven environments.
Comprehensive monitoring and troubleshooting solution for microservices architectures, offering metrics, traces, and logs in a single pane.
SigNoz is a powerful, open-source observability platform designed for modern, cloud-native applications. It provides a unified solution for monitoring, troubleshooting, and optimizing your microservices architecture.
Key benefits of SigNoz include:
All-in-One Observability: Combine metrics, traces, and logs in a single platform, eliminating the need for multiple tools and reducing context-switching.
Cost-Effective: As an open-source solution, SigNoz offers significant cost savings compared to proprietary alternatives, especially for high-volume data ingestion.
Easy Setup: Get started quickly with a simple installation process and intuitive UI, making it accessible for teams of all sizes.
Customizable Dashboards: Create tailored views of your system's performance with flexible, drag-and-drop dashboard builders.
Distributed Tracing: Gain deep insights into request flows across your microservices, helping you identify bottlenecks and optimize performance.
Anomaly Detection: Leverage built-in anomaly detection capabilities to proactively identify issues before they impact your users.
Scalability: Designed to handle high-volume data ingestion, SigNoz scales effortlessly with your growing infrastructure.
Open Standards: Built on OpenTelemetry, ensuring compatibility with a wide range of technologies and future-proofing your observability stack.
By choosing SigNoz, you're not just adopting a monitoring tool; you're embracing a comprehensive observability solution that grows with your needs and empowers your team to maintain high-performing, reliable applications.
Monitor infrastructure for exploitable vulnerabilities with real-time detection, automated workflows, and zero false positives.
ProjectDiscovery delivers enterprise-grade vulnerability management with a focus on detecting only exploitable vulnerabilities to eliminate false positives. The platform features real-time infrastructure monitoring that provides instant visibility into your entire tech stack as teams deploy.
Key capabilities include:
The platform is trusted by over 100,000 security professionals to transform noisy scan results into relevant, actionable alerts that enable 10x faster vulnerability triage and remediation.
Uptrace is an OpenTelemetry-based platform that integrates traces, metrics, and logs to help monitor and optimize complex distributed systems.
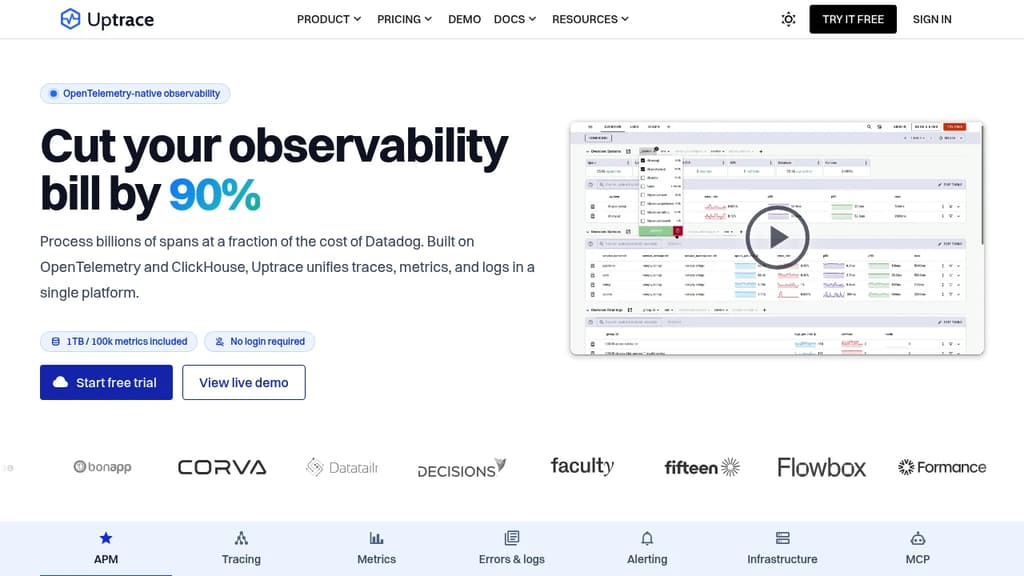
Uptrace is an open-source observability platform built on OpenTelemetry, designed to help developers and operations teams monitor, understand, and optimize complex distributed systems. It offers a comprehensive solution for application performance monitoring (APM) with integrated tracing, metrics, and logging capabilities.
Key features and benefits:
All-in-one solution:
Flexible deployment options:
Cost-effective and predictable pricing:
OpenTelemetry integration:
Comprehensive monitoring dashboard:
Scalability:
Incident response:
By offering a unified platform for observability, Uptrace simplifies the monitoring process and provides valuable insights into application performance, helping teams optimize their systems and respond to incidents more effectively.
Monitor networks, servers, and cloud environments with flexible open-source solution. Custom checks, fast alerts, and complete infrastructure control.
Complete visibility across your entire IT landscape with this comprehensive open-source monitoring platform. Whether managing on-premises servers, cloud environments, or hybrid infrastructures, you get the flexibility and control needed for complex enterprise monitoring.
Key capabilities include:
Comprehensive monitoring solutions cover Kubernetes clusters, database performance, Windows and VMware environments, plus business-critical applications. The platform bridges monitoring with IT service workflows and security operations for unified visibility.
Enterprise-ready features include automation capabilities, API-driven processes, extensive integrations with existing DevOps tools, and professional support options. Built on open-source principles while delivering enterprise-grade stability, security, and customization options that adapt to your operational needs.
Free open source IT monitoring solution for servers, networks, and applications. Trusted by 1M+ users worldwide with powerful alerting and enterprise-grade features.
Nagios is the industry-standard open source monitoring solution that has been protecting critical IT infrastructure for over 25 years. Trusted by more than 1 million users worldwide, this powerful platform provides comprehensive monitoring and alerting for servers, networks, applications, and services.
The platform offers complete infrastructure monitoring capabilities, supporting Windows, Linux systems, and network devices to prevent downtime before it impacts business operations. With its powerful plugin architecture, users can extend functionality through thousands of community-developed plugins, including NRPE, NSCA, and custom monitoring solutions.
Key benefits include:
The Nagios Core Services Platform provides everything needed in one comprehensive package, including the monitoring engine, 50+ official plugins, cross-platform agents, and configuration tools. Whether you're monitoring simple setups or complex enterprise infrastructure, Nagios delivers the flexibility and reliability needed to maintain optimal system performance.

Modern auth infrastructure for developers. Add multi-tenancy, enterprise SSO, and RBAC to your SaaS or AI apps.
Get started for free
Open-source, developer-first platform for automated compliance, risk management, and built-in Trust Center.
Get started for free CodeRabbit