Open Source Auvik Alternatives
A curated collection of the 5 best open source alternatives to Auvik.
The best open source alternative to Auvik is Scanopy. If that doesn't suit you, we've compiled a ranked list of other open source Auvik alternatives to help you find a suitable replacement. Other interesting open source alternatives to Auvik are: Zabbix, Checkmk, Icinga, and Nagios.
Auvik alternatives are mainly Infrastructure Monitoring Tools. Browse these if you want a narrower list of alternatives or looking for a specific functionality of Auvik.

Written by Piotr Kulpinski


Discovers your network via SNMP, LLDP, and ARP, then builds and maintains L2/L3 topology diagrams, host inventories, and service dependency maps automatically.
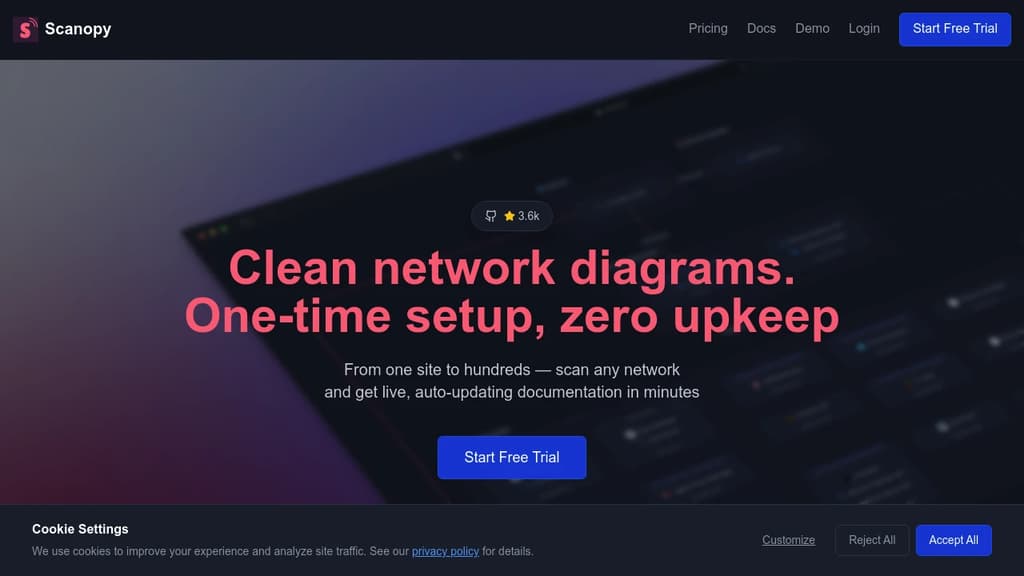
Scanopy scans your network and builds living documentation from what it finds, no manual diagramming required. It discovers hosts, maps physical and logical topology, fingerprints each device, and tracks the services and workloads running across your infrastructure. Everything stays current on a schedule, so your diagrams reflect the network as it actually is, not as it was when someone last had time to update a draw.io file.
A single scan produces four distinct views:
- Physical (L2) topology showing switch-level connectivity and port mapping
- Logical (L3) topology for IP addressing and routing relationships
- Workload and service maps capturing dependencies without APM instrumentation
- Host inventory with per-device fingerprinting and metadata
Scanopy uses SNMP, LLDP, and ARP for discovery, which means it works with existing infrastructure rather than requiring agents on every device. For environments with hundreds of switches, that's the only practical approach.
The scanner is free and open-source under AGPL-3.0, and the full stack can be self-hosted. There's no per-device pricing, which makes it predictable for large environments where tools like Auvik or Paessler PRTG get expensive fast. Paid tiers start at $11.99/month and lift the self-host caps.
It's built for a few distinct audiences. IT ops teams get always-current topology without manual upkeep. MSPs get per-client documentation with live portals that don't require client logins. Security and compliance teams get network segmentation validation and audit-ready exports, relevant for frameworks like NIS2. Platform and DevOps teams can see service dependencies and workload placement without standing up a full observability stack like SigNoz or Uptrace.
The hosted version is available immediately. Self-hosting runs the full stack in your own environment.

Monitors networks, servers, cloud services, IoT, and OT environments with no per-device licensing fees, available self-hosted or as a managed SaaS platform.

Zabbix is a full-scale observability platform built for enterprises that need to monitor everything from physical servers and network devices to cloud workloads, IoT sensors, and operational technology. It's been deployed in over 300,000 environments across 190+ countries, and its fixed-cost support model (no per-device charges, no license fees) makes it a practical choice for large-scale operations where commercial tools get expensive fast.
The platform covers IT and OT in a single interface, giving teams one place to track infrastructure health across data centers, cloud providers, and edge locations. You can deploy it on your own infrastructure for full data ownership, run it on public clouds like AWS, Azure, or Google Cloud, or use Zabbix Cloud as a fully managed SaaS option. All three paths give you the same monitoring capabilities.
Key capabilities include:
- Automated discovery that finds and begins monitoring new devices without manual configuration
- Webhook integrations for connecting to external systems like ticketing or incident management tools
- Multitenant support designed for managed service providers running monitoring across multiple clients
- Log monitoring alongside metrics, so infrastructure and application data live in one platform
- Real-time alerting with configurable thresholds and escalation paths
Compared to tools like Nagios or Icinga, Zabbix ships with a more polished web interface and broader built-in integrations out of the box. Teams that want richer visualization can connect it to Grafana for dashboards. For those evaluating cloud-native observability stacks, SigNoz and OpenObserve are worth comparing, though they focus more on traces and logs than on the broad infrastructure monitoring Zabbix covers.
With 24/7 support averaging a 12-minute response time and a global partner network of 290+ certified providers, Zabbix is built for organizations that treat monitoring as critical infrastructure, not an afterthought.
Monitor your entire IT infrastructure with 2,000+ plugins, automated discovery, and scalable architecture. Open source and enterprise solutions available.
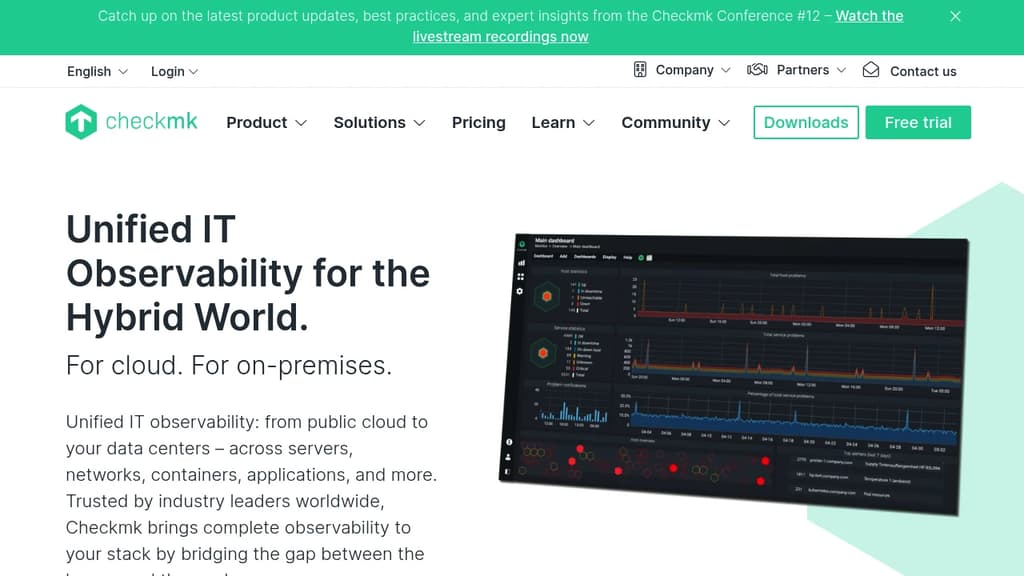
Comprehensive IT monitoring that scales from small teams to enterprise environments with millions of services. Checkmk automatically discovers and monitors your entire infrastructure - from cloud providers to data centers, servers, networks, containers, and applications.
Key advantages include:
- 2,000+ vendor-maintained plugins for out-of-the-box monitoring of virtually any system
- Automated discovery and configuration via REST API reduces manual setup time
- High-performance core designed to handle massive scale while maintaining a small footprint
- Granular alerting system that notifies only relevant teams and integrates with ServiceNow, Jira, Slack, and more
Multiple deployment options cater to different needs:
- Raw Edition: Free open-source version for mid-sized infrastructures
- Enterprise Edition: Advanced automation and visualization features
- Cloud Edition: SaaS solution optimized for hybrid cloud environments
- MSP Edition: Multi-tenant capabilities for service providers
Advanced features include dynamic dashboards, business intelligence mapping, custom self-healing actions, and comprehensive SLA reporting. The platform combines infrastructure monitoring with log analysis, synthetic testing capabilities, and historical performance forecasting to provide complete visibility into your IT operations.

Monitor networks, servers, and cloud environments with flexible open-source solution. Custom checks, fast alerts, and complete infrastructure control.
Complete visibility across your entire IT landscape with this comprehensive open-source monitoring platform. Whether managing on-premises servers, cloud environments, or hybrid infrastructures, you get the flexibility and control needed for complex enterprise monitoring.
Key capabilities include:
- Real-time monitoring of servers, networks, applications, and services
- Custom check configurations tailored to your specific requirements
- Fast alerting system to detect and respond to issues before they escalate
- Scalable architecture that grows with your infrastructure needs
- Multi-tenancy support for enterprise environments
- High availability configurations for mission-critical monitoring
Comprehensive monitoring solutions cover Kubernetes clusters, database performance, Windows and VMware environments, plus business-critical applications. The platform bridges monitoring with IT service workflows and security operations for unified visibility.
Enterprise-ready features include automation capabilities, API-driven processes, extensive integrations with existing DevOps tools, and professional support options. Built on open-source principles while delivering enterprise-grade stability, security, and customization options that adapt to your operational needs.

Free open source IT monitoring solution for servers, networks, and applications. Trusted by 1M+ users worldwide with powerful alerting and enterprise-grade features.
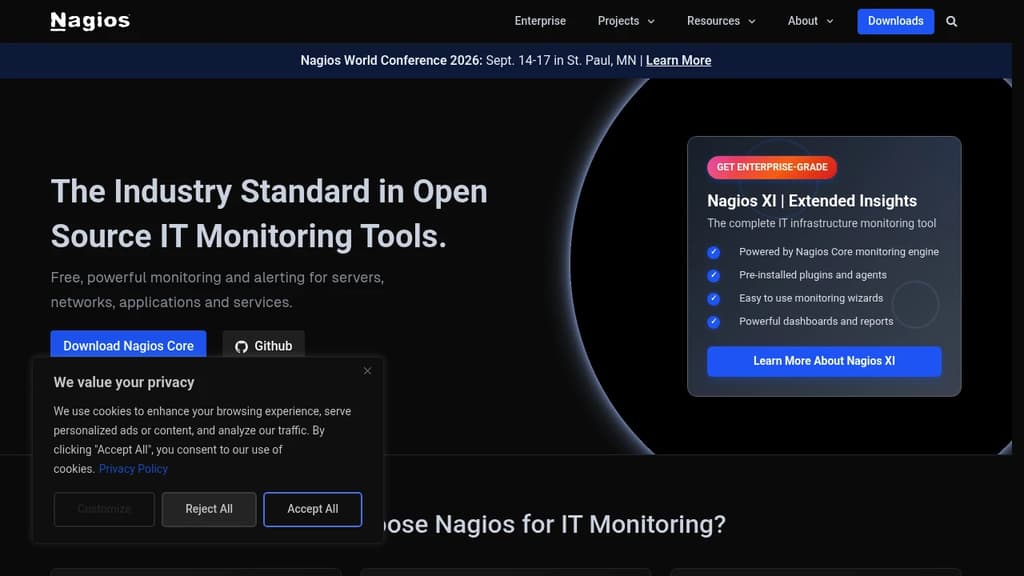
Nagios is the industry-standard open source monitoring solution that has been protecting critical IT infrastructure for over 25 years. Trusted by more than 1 million users worldwide, this powerful platform provides comprehensive monitoring and alerting for servers, networks, applications, and services.
The platform offers complete infrastructure monitoring capabilities, supporting Windows, Linux systems, and network devices to prevent downtime before it impacts business operations. With its powerful plugin architecture, users can extend functionality through thousands of community-developed plugins, including NRPE, NSCA, and custom monitoring solutions.
Key benefits include:
- Free, enterprise-grade monitoring with intuitive wizards and dashboards
- 573+ community add-ons available through Nagios Exchange
- Pre-configured solutions including Nagios XI for extended insights
- Global community support with active development and contributions
- Proven reliability with 4+ years in production environments
The Nagios Core Services Platform provides everything needed in one comprehensive package, including the monitoring engine, 50+ official plugins, cross-platform agents, and configuration tools. Whether you're monitoring simple setups or complex enterprise infrastructure, Nagios delivers the flexibility and reliability needed to maintain optimal system performance.

People are looking for alternatives to...
View all alternatives
Spotify

Claude Code

CapCut

Claude

Notion

Lovable
 Bright Data – Web data for AI agents and apps. Built-in unblocking, proxies, and ready-made APIs.
 Sent
Sent