Open Source Cronitor Alternatives
A curated collection of the 2 best open source alternatives to Cronitor.
The best open source alternative to Cronitor is Uptime Kuma. If that doesn't suit you, we've compiled a ranked list of other open source Cronitor alternatives to help you find a suitable replacement. Other interesting open source alternative to Cronitor is Healthchecks.
Cronitor alternatives are mainly Uptime Monitoring Tools but may also be Infrastructure Monitoring Tools or Status Pages. Browse these if you want a narrower list of alternatives or looking for a specific functionality of Cronitor.

Written by Piotr Kulpinski


Monitors websites, APIs, and services with real-time alerts, a status page, and support for dozens of notification channels. Self-hosted and Docker-friendly.
Uptime Kuma is a self-hosted uptime monitoring tool built for teams and individuals who want full control over their monitoring data without relying on a third-party SaaS. It's a popular UptimeRobot alternative you can run on your own infrastructure.
The interface is clean and reactive, showing live status for all your monitors without needing a page refresh. You can track HTTP(S) endpoints, TCP ports, DNS records, Docker containers, databases, and more. Each monitor gets its own response time graph and uptime history.
Key capabilities include:
- 90+ notification integrations covering Slack, Telegram, Discord, PagerDuty, email, webhooks, and many others
- Status pages you can publish publicly or keep private, with custom domains and branding
- Multiple monitor types including keyword matching, JSON query checks, gRPC, and certificate expiry monitoring
- Maintenance windows to pause alerts during planned downtime
- Two-factor authentication and multi-user support for team access
- Ping and heartbeat monitors for cron jobs and background tasks
Compared to tools like Checkmate or OpenStatus, Uptime Kuma is deliberately lightweight. It runs as a single Docker container with no external database required, storing everything in SQLite. That makes it easy to self-host on a small VPS or home server without much overhead.
It doesn't offer distributed probing from multiple global locations out of the box, which tools like Peekaping do. But for a single-node monitor covering your own services, it covers the essentials well and has a large, active community behind it.

Monitors cron jobs, background workers, and scheduled tasks by expecting periodic HTTP pings and alerting you when they stop arriving on time.
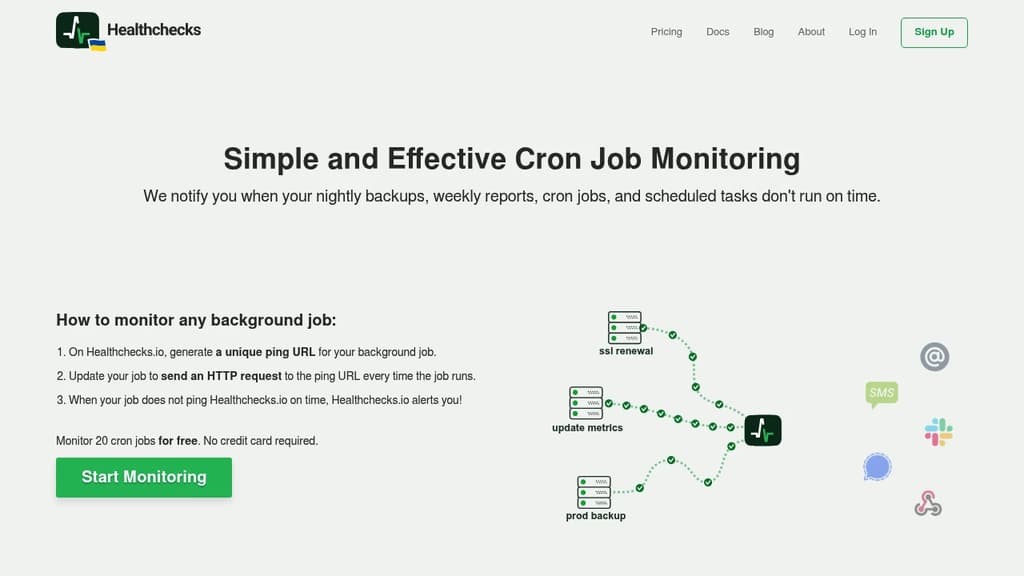
Healthchecks.io works on a dead man's switch model: your job pings a unique URL each time it runs, and if a ping doesn't arrive within the expected window, you get an alert. No agent to install, no complex config. Just add an HTTP request to your existing script and you're covered.
It's built for developers and small teams who run scheduled tasks and want to know immediately when something silently fails. A missed backup or a broken import job often leaves no visible trace until the damage is done.
What you can monitor:
- Cron jobs and systemd timers on Linux, including database backups, report emails, SSL renewals, and data sync jobs
- Windows Scheduled Tasks, Kubernetes CronJobs, GitHub Actions workflows, Heroku Scheduler, and similar platforms
- Processes and services, by pairing a health-check script with a recurring ping (useful for confirming a Docker container or database replication is healthy)
- IoT devices and servers, sending simple "I'm alive" pings from a Raspberry Pi, NAS, or router
Each check has a configurable Period (how often you expect a ping) and Grace Time (how late a ping can arrive before triggering an alert). Checks move through four states: New, Up, Late, and Down. You're only notified when a check transitions from Late to Down, so you won't get flooded with alerts for brief delays.
For more complex schedules, you can define expected run times using a standard cron expression instead of a fixed period.
The dashboard lists all your checks at a glance. You can tag checks, toggle notification integrations per check, and review a full event log of pings and alerts. Each check also supports a free-form description for notes your team might need during an incident.
Notification integrations include: Email, webhooks, PagerDuty-style tools like Opsgenie and Spike.sh, chat platforms (Discord, Signal, WhatsApp, Matrix, Zulip, Microsoft Teams), push services (Pushbullet, ntfy, Gotify), SMS, phone calls, and GitHub Issues.
Status badges are available per tag and for your whole account, with hard-to-guess public URLs suitable for READMEs or internal dashboards. Up to 20 checks are free with no credit card required. For teams needing more, it's self-hostable as an open source alternative to UptimeRobot and similar services, with the full source available for private deployment.

People are looking for alternatives to...
View all alternatives
Spotify

Claude Code

CapCut

Claude

Notion

Lovable
 Sent – A unified API for sending messages across SMS, RCS, and apps like WhatsApp.
 Sent
Sent