Open Source Sentry Alternatives
A curated collection of the 4 best open source alternatives to Sentry.
The best open source alternative to Sentry is HyperDX. If that doesn't suit you, we've compiled a ranked list of other open source Sentry alternatives to help you find a suitable replacement. Other interesting open source alternatives to Sentry are: Highlight, Bugsink, and GlitchTip.
Sentry alternatives are mainly Error Tracking Tools but may also be Performance Monitoring (APM) Tools or Log Management Tools. Browse these if you want a narrower list of alternatives or looking for a specific functionality of Sentry.

Written by Piotr Kulpinski


Open source observability platform unifying session replays, logs, traces, metrics and errors. Fast search, automatic clustering, $0.40/GB pricing.
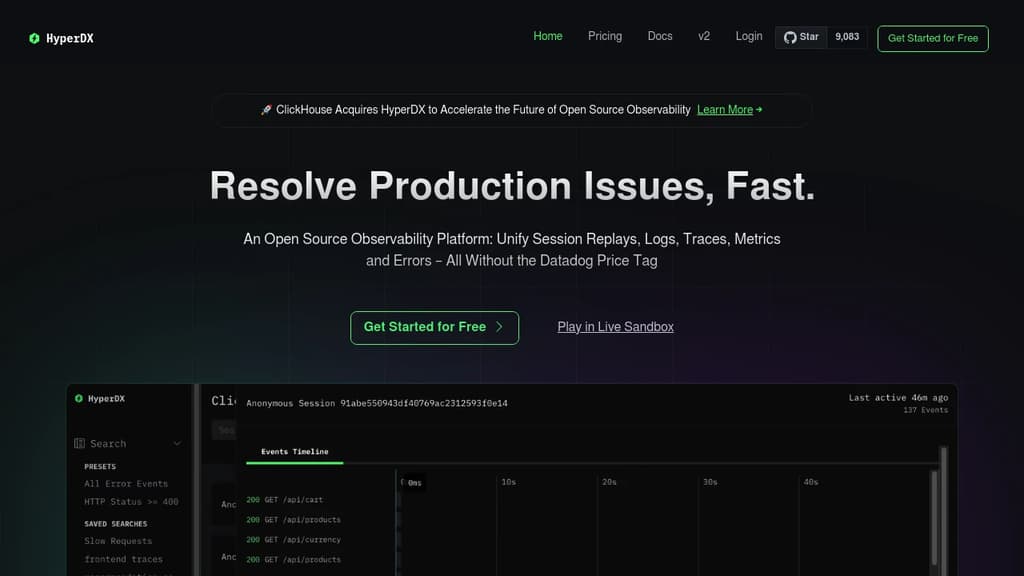
Open source observability platform that unifies session replays, logs, traces, metrics and errors into a single view - all without the expensive Datadog price tag. Recently acquired by ClickHouse to accelerate open source observability innovation.
Key capabilities include:
- End-to-end correlation - Trace requests from user browsers to backend servers and async workers automatically
- Blazing fast search - Query terabytes of events in seconds, powered by ClickHouse
- Automatic clustering - Condense billions of events into distinctive patterns without manual configuration
- Session replay integration - Automatically link user sessions with backend logs and traces
- Intuitive visualization - Build charts and graphs with simple full-text search, no complex syntax required
Developer-friendly features:
- OpenTelemetry-powered instrumentation prevents vendor lock-in
- Agent-free installation option eliminates infrastructure overhead
- Native JSON parsing for structured logs with zero configuration
- Real-time live tail for immediate log stream monitoring
- Intercom integration for jumping directly from support tickets to user sessions
Transparent pricing at $0.40 per GB with no per-user or per-host fees makes enterprise-grade observability accessible to teams of all sizes. Trusted by high-velocity engineering teams for resolving production issues fast.

Comprehensive monitoring solution offering error tracking, session replay, and performance insights for seamless debugging and optimization.
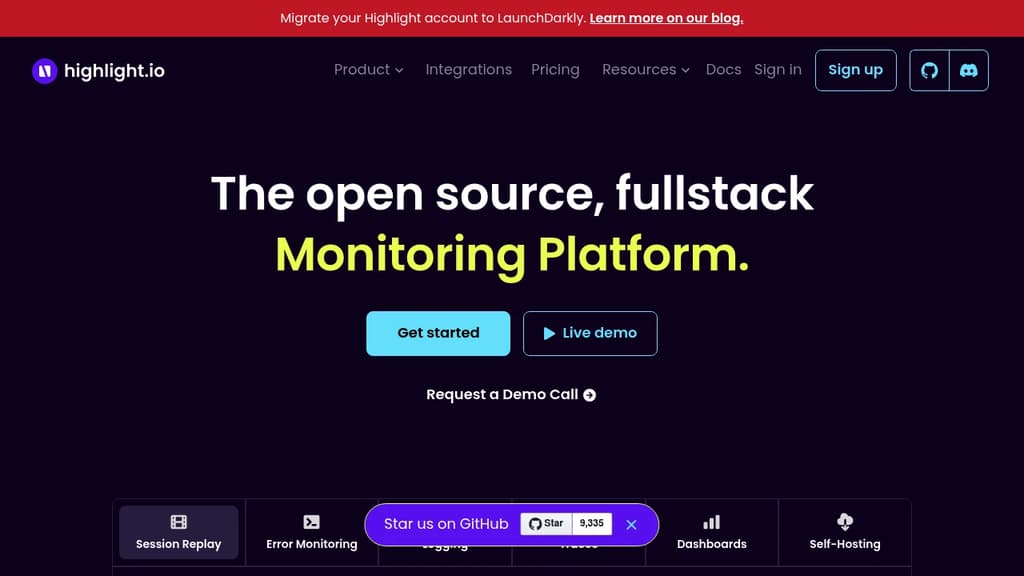
Highlight is a powerful observability platform designed to revolutionize how developers monitor and debug web applications. By combining error tracking, session replay, and performance monitoring in a single, intuitive interface, Highlight provides unparalleled insights into your application's behavior.
Key benefits of Highlight include:
- Error Tracking: Instantly capture and diagnose errors with detailed stack traces, error context, and affected user information.
- Session Replay: Visualize user interactions with pixel-perfect recreations of sessions, helping you understand and reproduce issues quickly.
- Performance Monitoring: Gain deep insights into your application's performance with metrics on load times, API calls, and resource usage.
- Real-time Alerts: Stay informed about critical issues with customizable alerts delivered via email, Slack, or other integrations.
- Easy Integration: Get started in minutes with simple SDK integration for popular frameworks and languages.
- Privacy-focused: Ensure data protection with automatic PII redaction and customizable data retention policies.
Highlight empowers development teams to identify, prioritize, and resolve issues faster, leading to improved application stability and enhanced user experiences. With its comprehensive feature set and user-friendly interface, Highlight is the go-to solution for modern web application observability.

Bugsink offers real-time error tracking with self-hosting capabilities, allowing easy installation and connection to any app using Sentry-compatible SDKs.
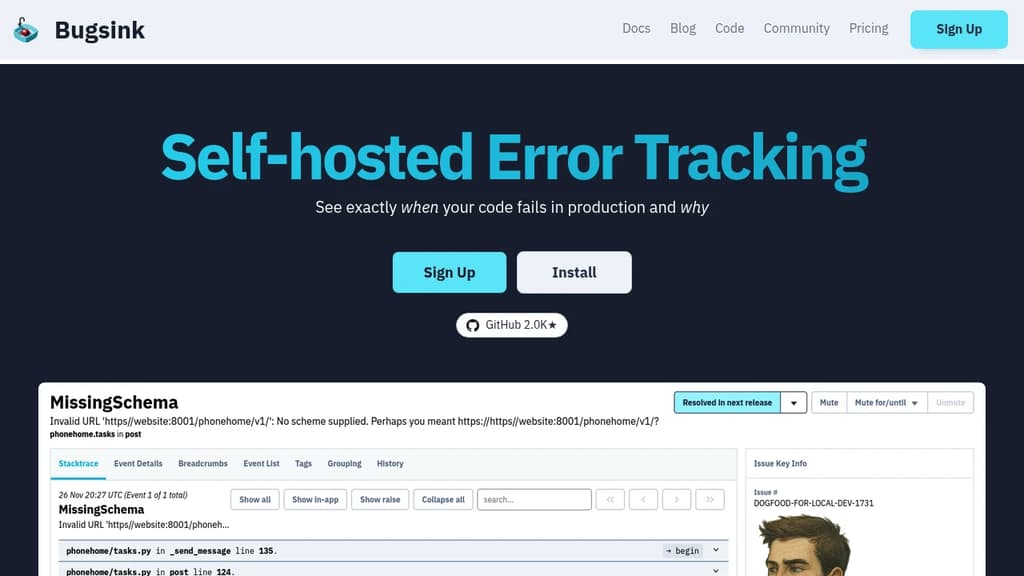
Bugsink is a powerful self-hosted error tracking solution designed for developers who want full control over their error monitoring infrastructure. With Bugsink, you can easily install the platform on your own servers and connect any application using Sentry-compatible SDKs.
Key features of Bugsink include:
- Self-hosted control: Install Bugsink on your own servers for complete data ownership and privacy.
- Real-time error tracking: Get instant notifications about errors in your applications as they occur.
- Sentry SDK compatibility: Seamlessly integrate with most popular programming languages using existing Sentry SDKs.
- Scalable performance: Handle millions of events daily without failure, ensuring reliability when you need it most.
- Comprehensive error details: Access all the information needed to triage and fix errors in one centralized location.
- Easy installation: Follow detailed instructions to get up and running quickly.
Bugsink empowers development teams to maintain high-quality applications by providing a robust, scalable, and self-controlled error tracking solution. Whether you're managing a small project or a large-scale application, Bugsink offers the tools you need to identify, analyze, and resolve issues efficiently.

Self-hostable error tracking platform compatible with Sentry SDKs. Tracks exceptions, monitors performance, checks uptime, and collects logs without the Sentry price tag.
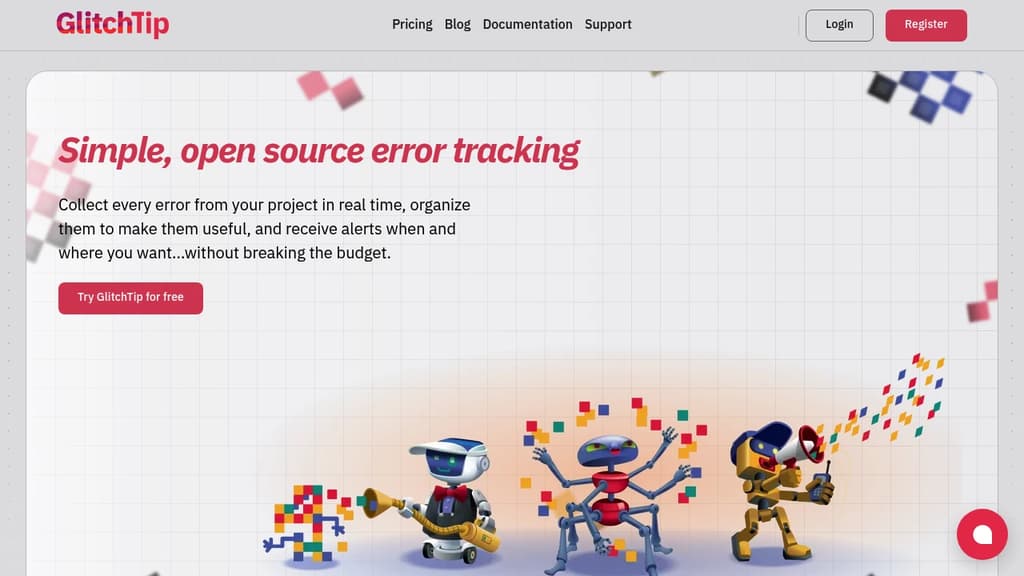
GlitchTip is an open source error tracking platform built for teams who want the functionality of Sentry without the cost or the vendor lock-in. It's compatible with Sentry's client SDKs, so you can point your existing instrumentation at GlitchTip without rewriting anything.
The focus is on simplicity. There's no dashboard-building ritual or metric-hunting before you can find what's wrong. You get organized errors, slow transaction data, and uptime status in one place, ready to act on.
What GlitchTip covers:
- Error tracking: Collects exceptions, log messages, and Content Security Policy violations from your app in real time. Triage and resolve issues from a single inbox.
- Performance monitoring: Surfaces your slowest web requests, database calls, and transactions without requiring manual dashboard setup.
- Uptime monitoring: Pings your site on a schedule and alerts you when it goes down. Also supports the reverse: send GlitchTip a heartbeat ping, and it alerts you if the ping stops arriving. Similar to what Healthchecks does for cron jobs.
- Logs: Search and filter application logs alongside errors and performance data, keeping context together during debugging.
Alerts go out via email or webhook, and you control when and how they fire.
You can self-host GlitchTip on your own infrastructure or use the hosted version at app.glitchtip.com. The hosted tier starts free for personal projects (up to 1,000 events per month) and scales to paid plans for larger teams. Self-hosting has no event caps imposed by the platform itself.
It's a practical fit for small teams and solo developers who find Bugsnag or Sentry too expensive, and for organizations that need to keep error data on their own servers for compliance or privacy reasons.

People are looking for alternatives to...
View all alternatives
Spotify

Claude Code

CapCut

Claude

Notion

Lovable
 Docmost – Open-source wiki software with real-time collaboration, diagrams, AI, SSO, RBAC permissions and more.
 CodeRabbit