Stars
Forks
Last commit
Stars
Forks
Last commit
Stars
Forks
Last commit
Stars
Forks
Last commit
Stars
Forks
Last commit
Stars
Forks
Last commit
Stars
Forks
Last commit
Stars
Forks
Last commit
Stars
Forks
Last commit
Stars
Forks
Last commit
Stars
Forks
Last commit
Stars
Forks
Last commit
The best open source alternative to HyperDX is SigNoz. If that doesn't suit you, we've compiled a ranked list of other open source HyperDX alternatives to help you find a suitable replacement. Other interesting open source alternatives to HyperDX are: Highlight and Uptrace.
HyperDX alternatives are mainly Performance Monitoring (APM) Tools but may also be Infrastructure Monitoring Tools or Log Management Tools. Browse these if you want a narrower list of alternatives or looking for a specific functionality of HyperDX.
Comprehensive monitoring and troubleshooting solution for microservices architectures, offering metrics, traces, and logs in a single pane.
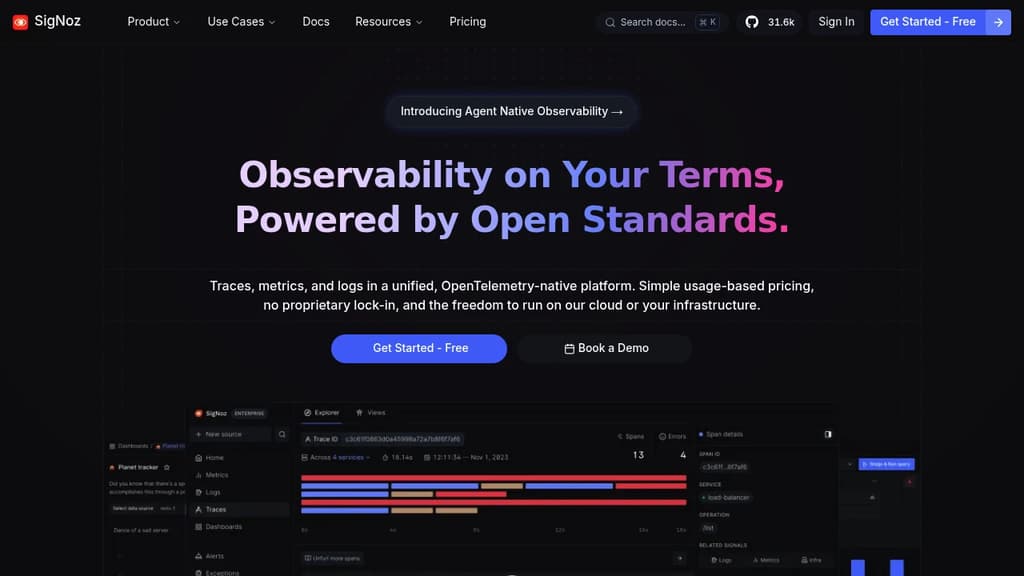
SigNoz is a powerful, open-source observability platform designed for modern, cloud-native applications. It provides a unified solution for monitoring, troubleshooting, and optimizing your microservices architecture.
Key benefits of SigNoz include:
All-in-One Observability: Combine metrics, traces, and logs in a single platform, eliminating the need for multiple tools and reducing context-switching.
Cost-Effective: As an open-source solution, SigNoz offers significant cost savings compared to proprietary alternatives, especially for high-volume data ingestion.
Easy Setup: Get started quickly with a simple installation process and intuitive UI, making it accessible for teams of all sizes.
Customizable Dashboards: Create tailored views of your system's performance with flexible, drag-and-drop dashboard builders.
Distributed Tracing: Gain deep insights into request flows across your microservices, helping you identify bottlenecks and optimize performance.
Anomaly Detection: Leverage built-in anomaly detection capabilities to proactively identify issues before they impact your users.
Scalability: Designed to handle high-volume data ingestion, SigNoz scales effortlessly with your growing infrastructure.
Open Standards: Built on OpenTelemetry, ensuring compatibility with a wide range of technologies and future-proofing your observability stack.
By choosing SigNoz, you're not just adopting a monitoring tool; you're embracing a comprehensive observability solution that grows with your needs and empowers your team to maintain high-performing, reliable applications.
Comprehensive monitoring solution offering error tracking, session replay, and performance insights for seamless debugging and optimization.
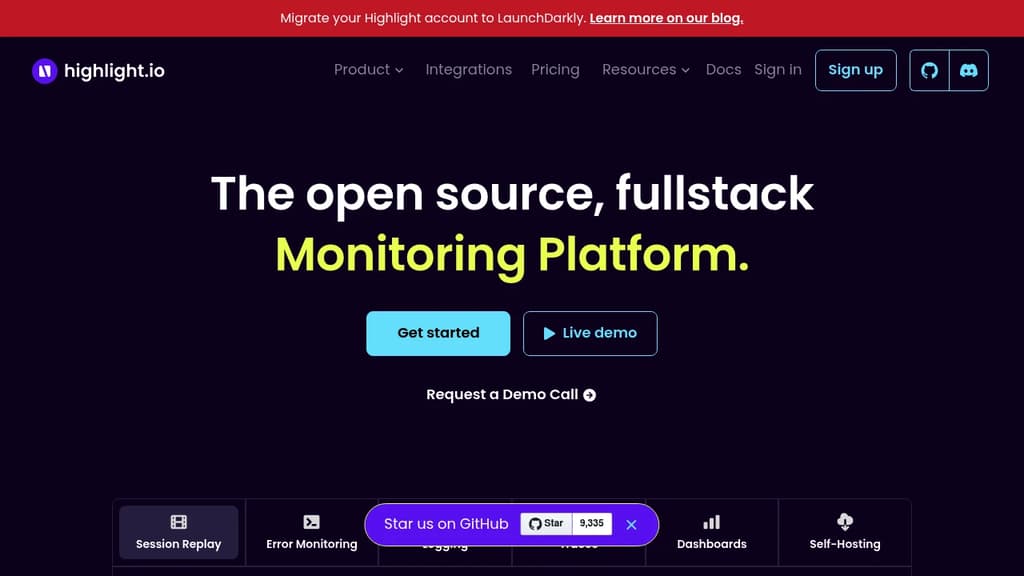
Highlight is a powerful observability platform designed to revolutionize how developers monitor and debug web applications. By combining error tracking, session replay, and performance monitoring in a single, intuitive interface, Highlight provides unparalleled insights into your application's behavior.
Key benefits of Highlight include:
Highlight empowers development teams to identify, prioritize, and resolve issues faster, leading to improved application stability and enhanced user experiences. With its comprehensive feature set and user-friendly interface, Highlight is the go-to solution for modern web application observability.
Uptrace is an OpenTelemetry-based platform that integrates traces, metrics, and logs to help monitor and optimize complex distributed systems.
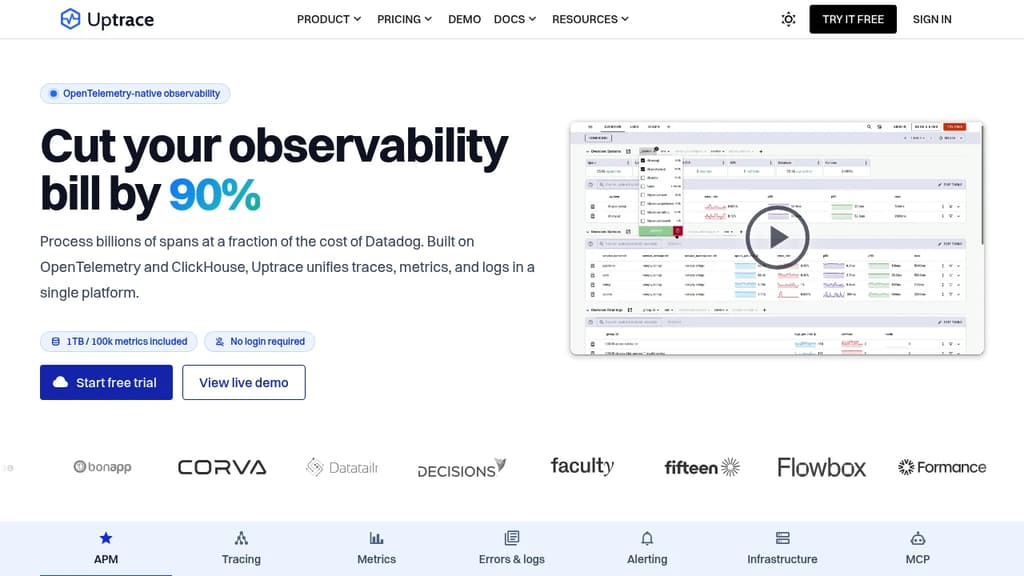
Uptrace is an open-source observability platform built on OpenTelemetry, designed to help developers and operations teams monitor, understand, and optimize complex distributed systems. It offers a comprehensive solution for application performance monitoring (APM) with integrated tracing, metrics, and logging capabilities.
Key features and benefits:
All-in-one solution:
Flexible deployment options:
Cost-effective and predictable pricing:
OpenTelemetry integration:
Comprehensive monitoring dashboard:
Scalability:
Incident response:
By offering a unified platform for observability, Uptrace simplifies the monitoring process and provides valuable insights into application performance, helping teams optimize their systems and respond to incidents more effectively.
Modern auth infrastructure for developers. Add multi-tenancy, enterprise SSO, and RBAC to your SaaS or AI apps.
Get started for free


 Sent
Sent